Fig. 5
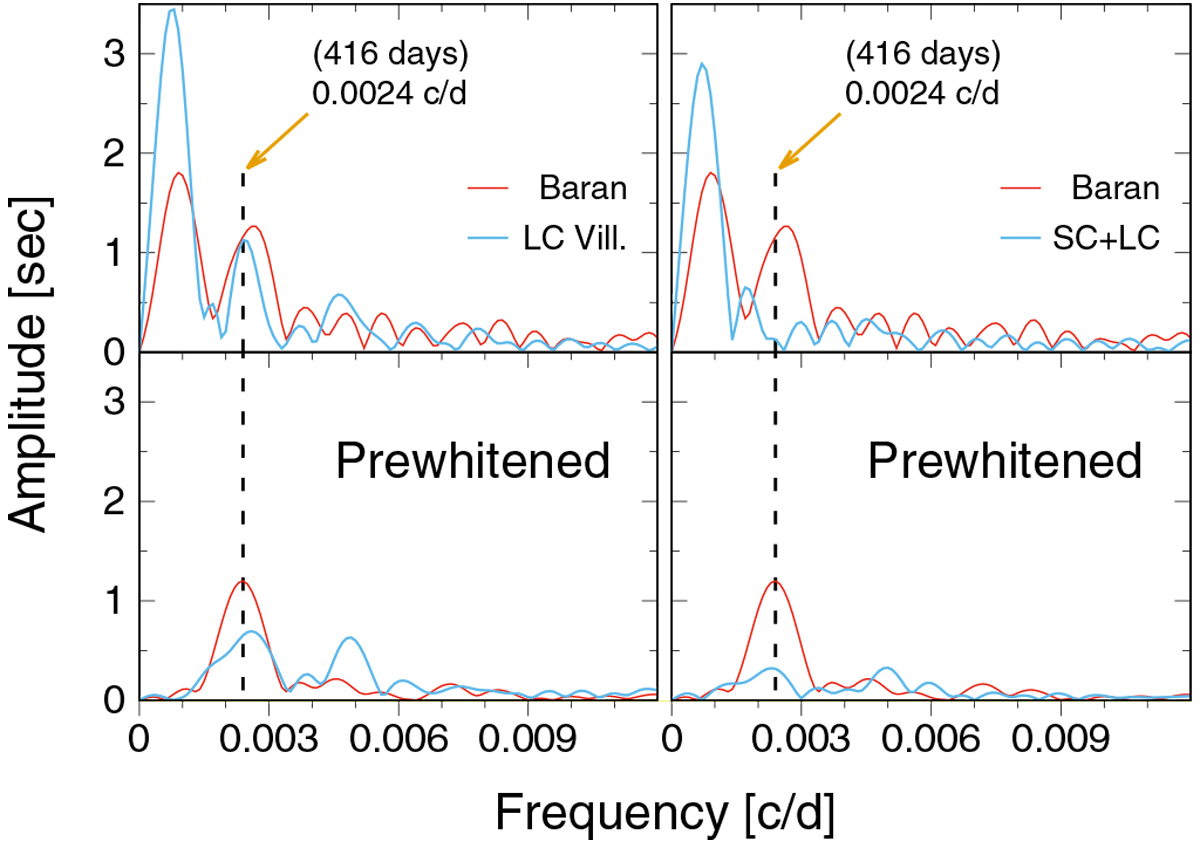
KIC 9472174: enlargement of 0 – 0.012 c/d FT-frequency region from Fig. 2. Red lines: SC Baran et al. (2015) data. Blue lines: this work, LC Villanova data (left panels), and SC+LC data (right panels). Top: O−C FTs before prewhitening. Bottom: after prewhitening the O−Cs for the longest periods. Vertical dashed lines at 0.0024 c/d show the orbital frequency location of the putative exoplanet.
Current usage metrics show cumulative count of Article Views (full-text article views including HTML views, PDF and ePub downloads, according to the available data) and Abstracts Views on Vision4Press platform.
Data correspond to usage on the plateform after 2015. The current usage metrics is available 48-96 hours after online publication and is updated daily on week days.
Initial download of the metrics may take a while.