Fig. 2
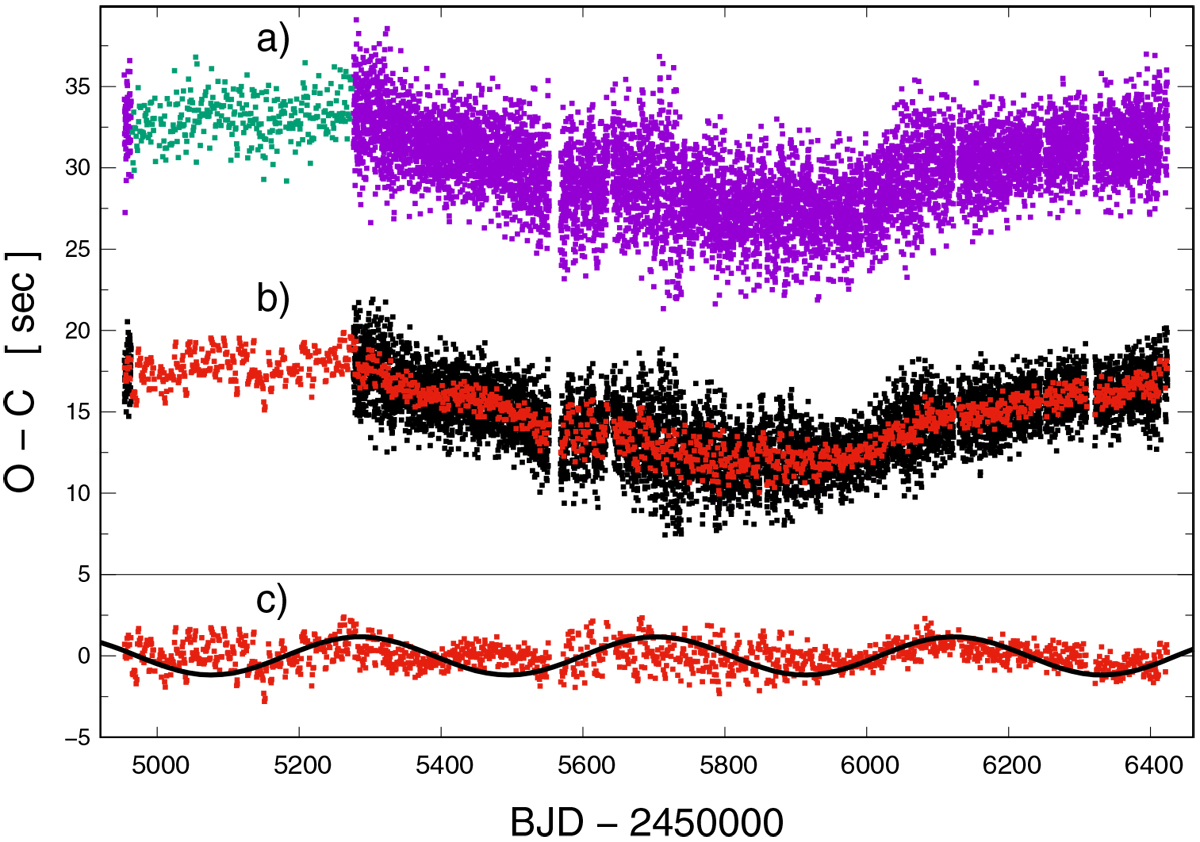
KIC 9472174: O−C diagrams calculated from: (a) SC and LC data (violet and green dots, respectively), and (b) data prewhitened from pulsations (black dots are the O−C from the single-template fit to the SC data; red dots represent the O−C from the seven-period template fit to the SC+LC data). The diagrams were shifted vertically to avoid overlapping. Bottom panel (c): O−C diagram from a seven-period template fit prewhitened for the 1430 day period. The black line shows a 416 day sinusoidal fit to the O−C from Fig. 3 of Baran et al. (2015).
Current usage metrics show cumulative count of Article Views (full-text article views including HTML views, PDF and ePub downloads, according to the available data) and Abstracts Views on Vision4Press platform.
Data correspond to usage on the plateform after 2015. The current usage metrics is available 48-96 hours after online publication and is updated daily on week days.
Initial download of the metrics may take a while.