Fig. 10
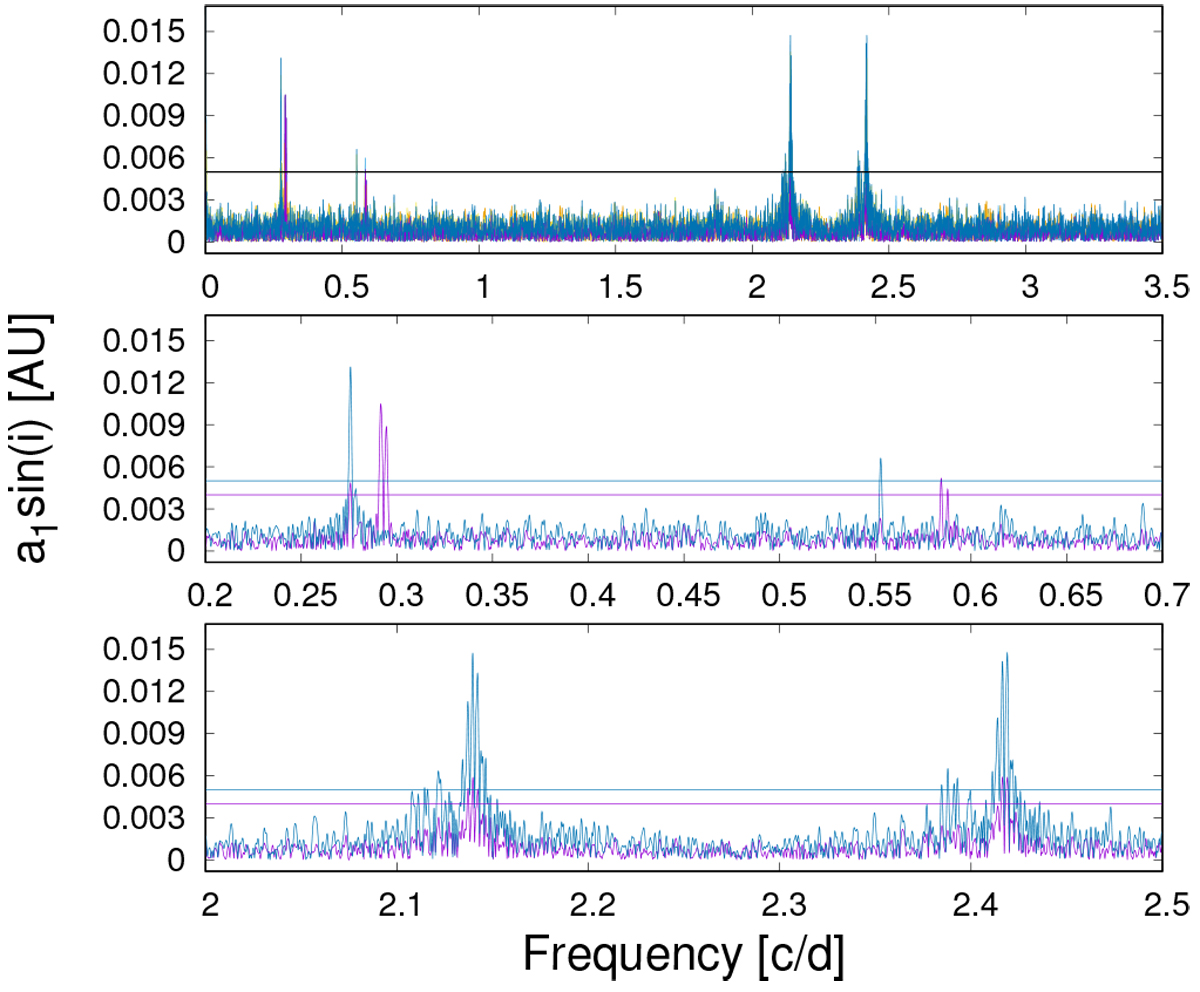
KIC 8626021: binarograms for different pulsation frequency sets (different line colors). Bottom panels: enlargements of two artifact regions around 0.27 c/d and 2.3 c/d from the top panel. We note that the detection threshold changes (horizontal lines near ~0.004 AU) depending on the frequency sets used to calculate the binarograms.
Current usage metrics show cumulative count of Article Views (full-text article views including HTML views, PDF and ePub downloads, according to the available data) and Abstracts Views on Vision4Press platform.
Data correspond to usage on the plateform after 2015. The current usage metrics is available 48-96 hours after online publication and is updated daily on week days.
Initial download of the metrics may take a while.