Free Access
Fig. 8
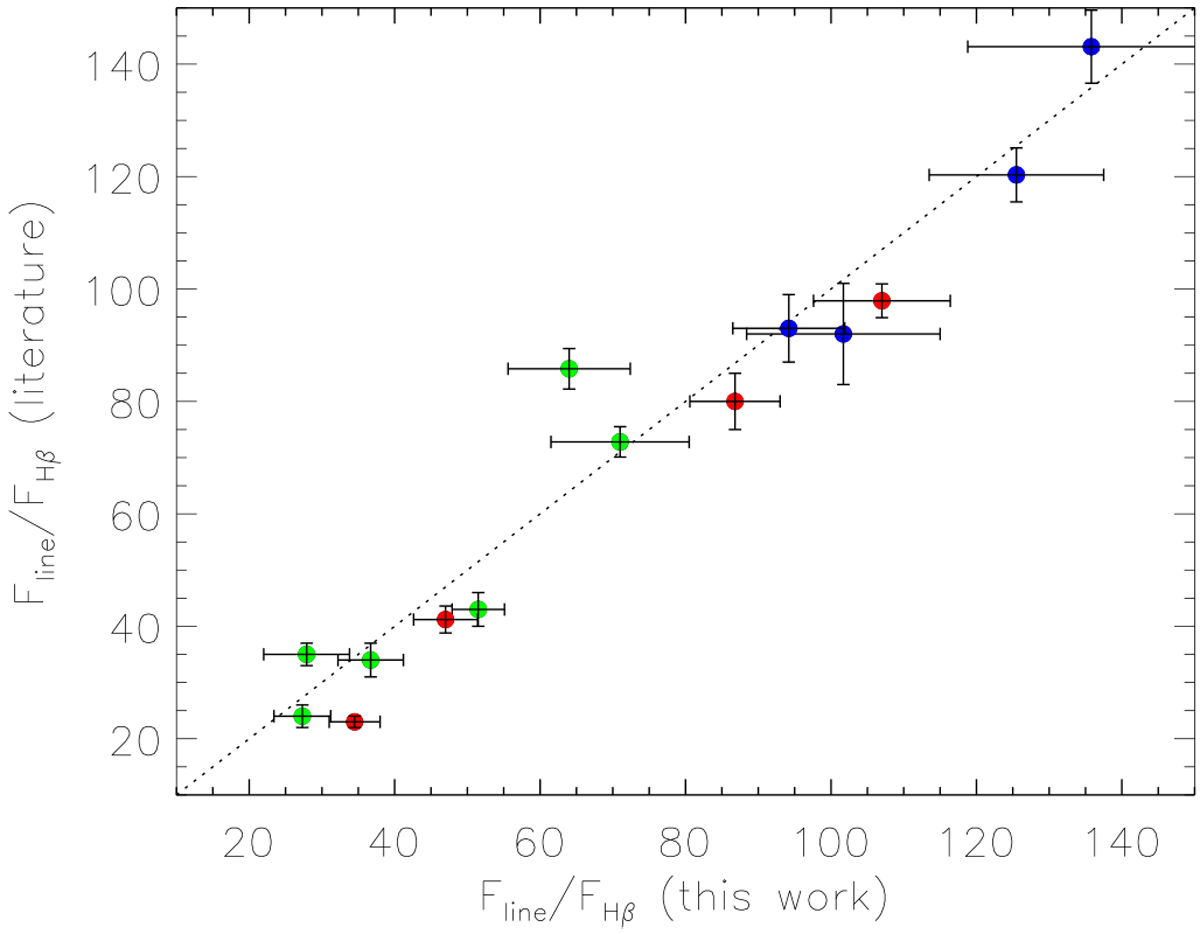
Comparison of reddening-corrected line intensities (in units of Hβ = 100), of the most common lines, measured in the current work (horizontal axis) and values from the literature (vertical axis). Red points refer to [OIII]λ5007, blue points to [NII]λ6583 and green points to [SII]λ6716 and [SII]λ6731.
Current usage metrics show cumulative count of Article Views (full-text article views including HTML views, PDF and ePub downloads, according to the available data) and Abstracts Views on Vision4Press platform.
Data correspond to usage on the plateform after 2015. The current usage metrics is available 48-96 hours after online publication and is updated daily on week days.
Initial download of the metrics may take a while.