Fig. 4
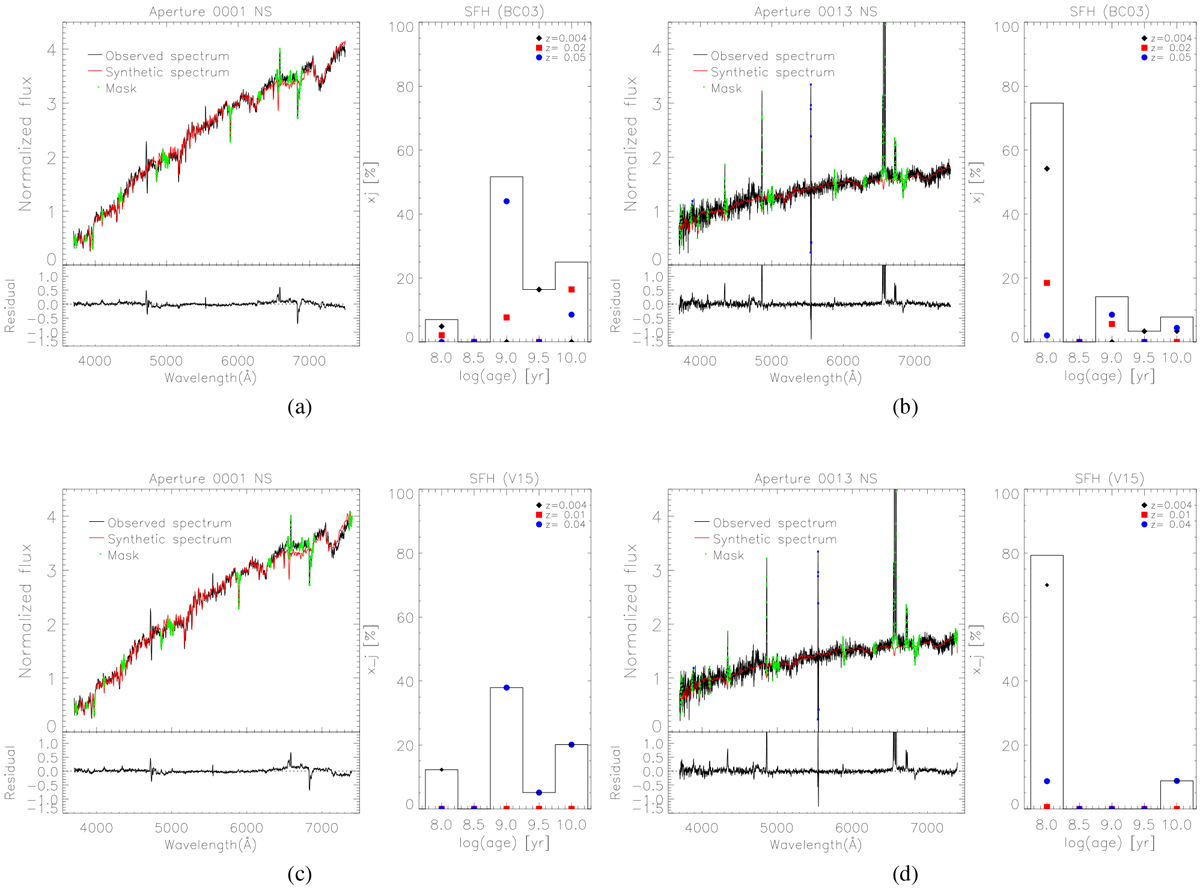
Example of the stellar population spectral fitting. (a) and (c): aperture 01 (nucleus of the galaxy, N-S slit) fitted with BC03 and V15 models, respectively, and (b) and (d): aperture 13(N-S slit), also fitted with BC03 and V15 models, respectively. In each figure, top left panel: observed spectrum inblack, and the fitted synthetic spectrum in red. The regions marked in green represent masked intervals, ignored by STARLIGHT because of the presence of emission lines. Bottom left panel: residual of the difference between the two. Right panel: star formation history (SFH), which means the contribution of each population age and metallicity to the final synthetic spectrum.
Current usage metrics show cumulative count of Article Views (full-text article views including HTML views, PDF and ePub downloads, according to the available data) and Abstracts Views on Vision4Press platform.
Data correspond to usage on the plateform after 2015. The current usage metrics is available 48-96 hours after online publication and is updated daily on week days.
Initial download of the metrics may take a while.