Fig. 1
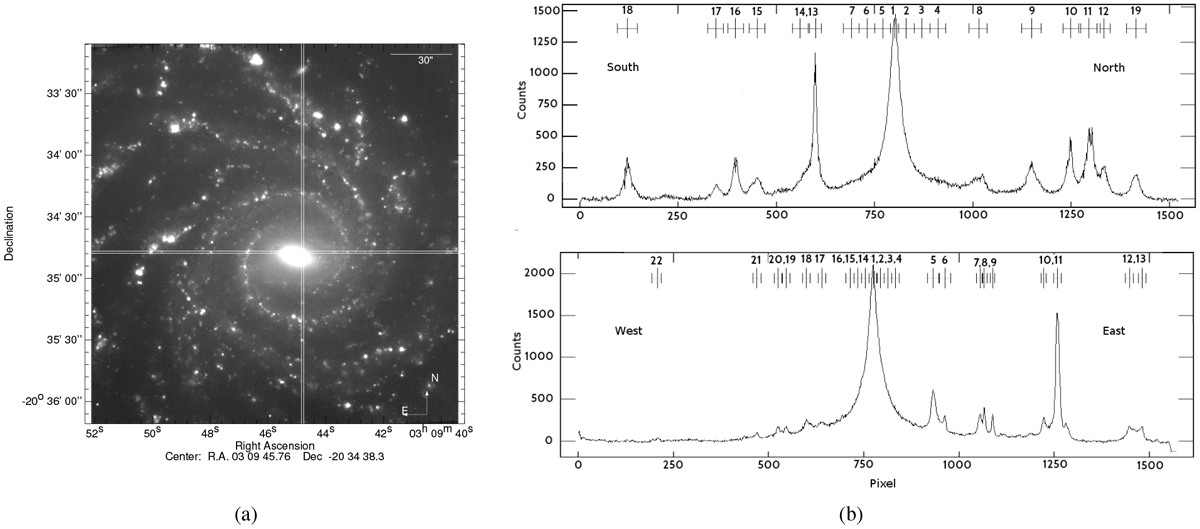
(a) Hα image of NGC 1232 from de Souza et al. (2018). The white lines represent the slits from where the HII regions were extracted along the N-S and E-W directions. (b) Spatial distribution of flux in Hα of the slits N-S (top) and E-W (bottom), showing the peaks which correspond to each HII region (and NGC 1232B) extracted. The numbers on top correspond to their names in Table 1 and the size of the extraction of each HII regions is shown by the ranges below these numbers.
Current usage metrics show cumulative count of Article Views (full-text article views including HTML views, PDF and ePub downloads, according to the available data) and Abstracts Views on Vision4Press platform.
Data correspond to usage on the plateform after 2015. The current usage metrics is available 48-96 hours after online publication and is updated daily on week days.
Initial download of the metrics may take a while.