Fig. 7.
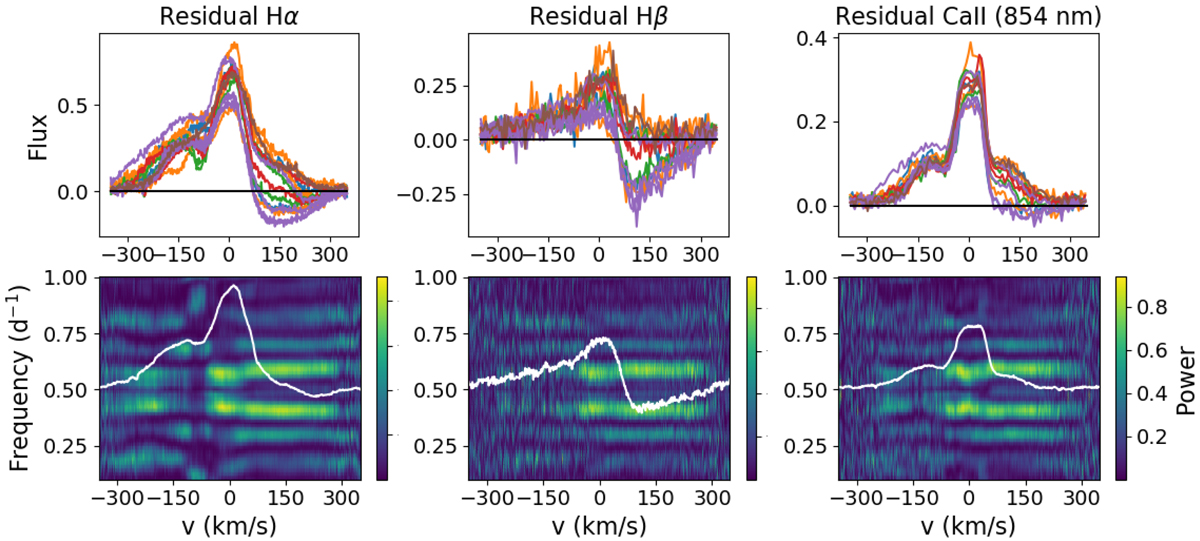
Top: residual Hα (left), Hβ (middle), and CaII 854.2 nm (right) emission lines of HQ Tau spectra. Bottom: corresponding 2D periodograms with the mean profile superimposed as a white curve. The maximum power of the periodogram is in yellow and the minimum in dark blue. The red and blue wings of Hα and the red wing of Hβ and CaII, as well as the center of the 3 line profiles, exhibit a periodic modulation at f ≈ 0.4 d−1, corresponding to the rotational period of the star. The power seen at f ≈ 0.6 d−1 is the 1-day alias induced by the observational window.
Current usage metrics show cumulative count of Article Views (full-text article views including HTML views, PDF and ePub downloads, according to the available data) and Abstracts Views on Vision4Press platform.
Data correspond to usage on the plateform after 2015. The current usage metrics is available 48-96 hours after online publication and is updated daily on week days.
Initial download of the metrics may take a while.