Fig. 1.
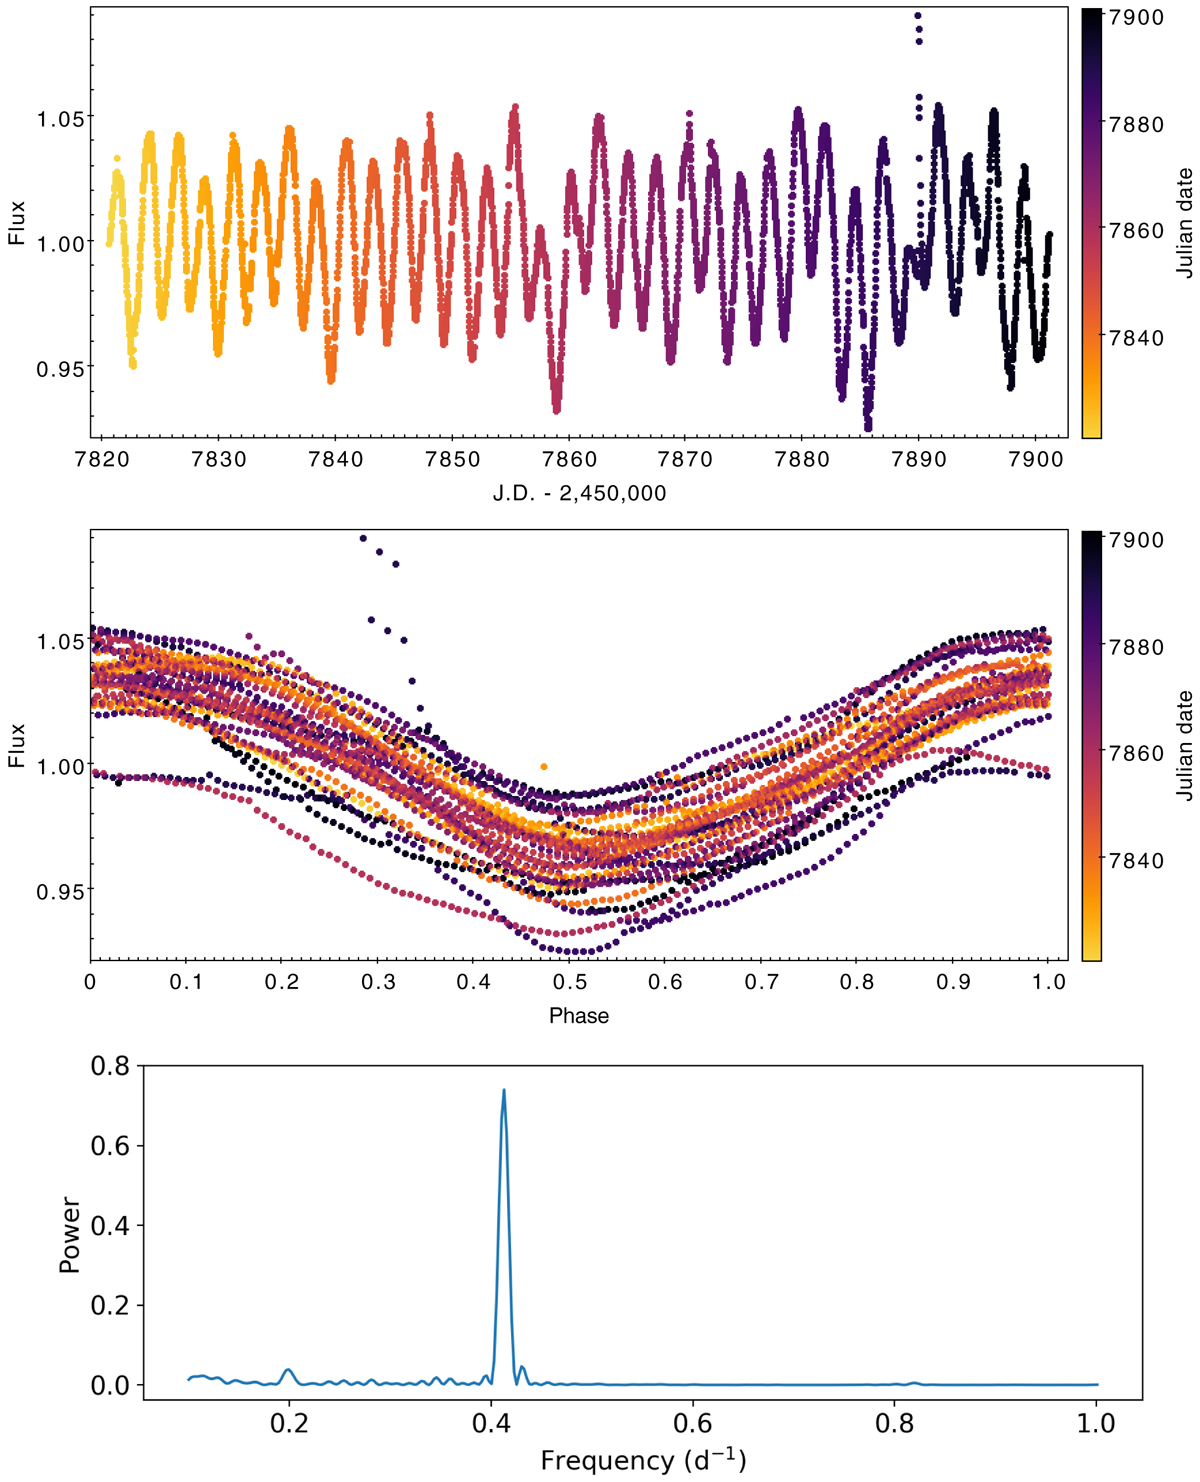
Top: HQ Tau’s detrended Kepler K2 light curve. Low frequency variations have been removed from the original light curve shown in Fig. 2. The spike appearing at J.D. 2 457 890.0 is presumably an instrumental defect. Middle: HQ Tau’s light curve folded in phase with P = 2.424 d. The origin of phase is taken as JD 2 457 823.81 to correspond to the epoch of maximum brightness. Bottom: lomb-Scargle periodogram obtained from HQ Tau’s Kepler K2 light curve.
Current usage metrics show cumulative count of Article Views (full-text article views including HTML views, PDF and ePub downloads, according to the available data) and Abstracts Views on Vision4Press platform.
Data correspond to usage on the plateform after 2015. The current usage metrics is available 48-96 hours after online publication and is updated daily on week days.
Initial download of the metrics may take a while.