Fig. 7.
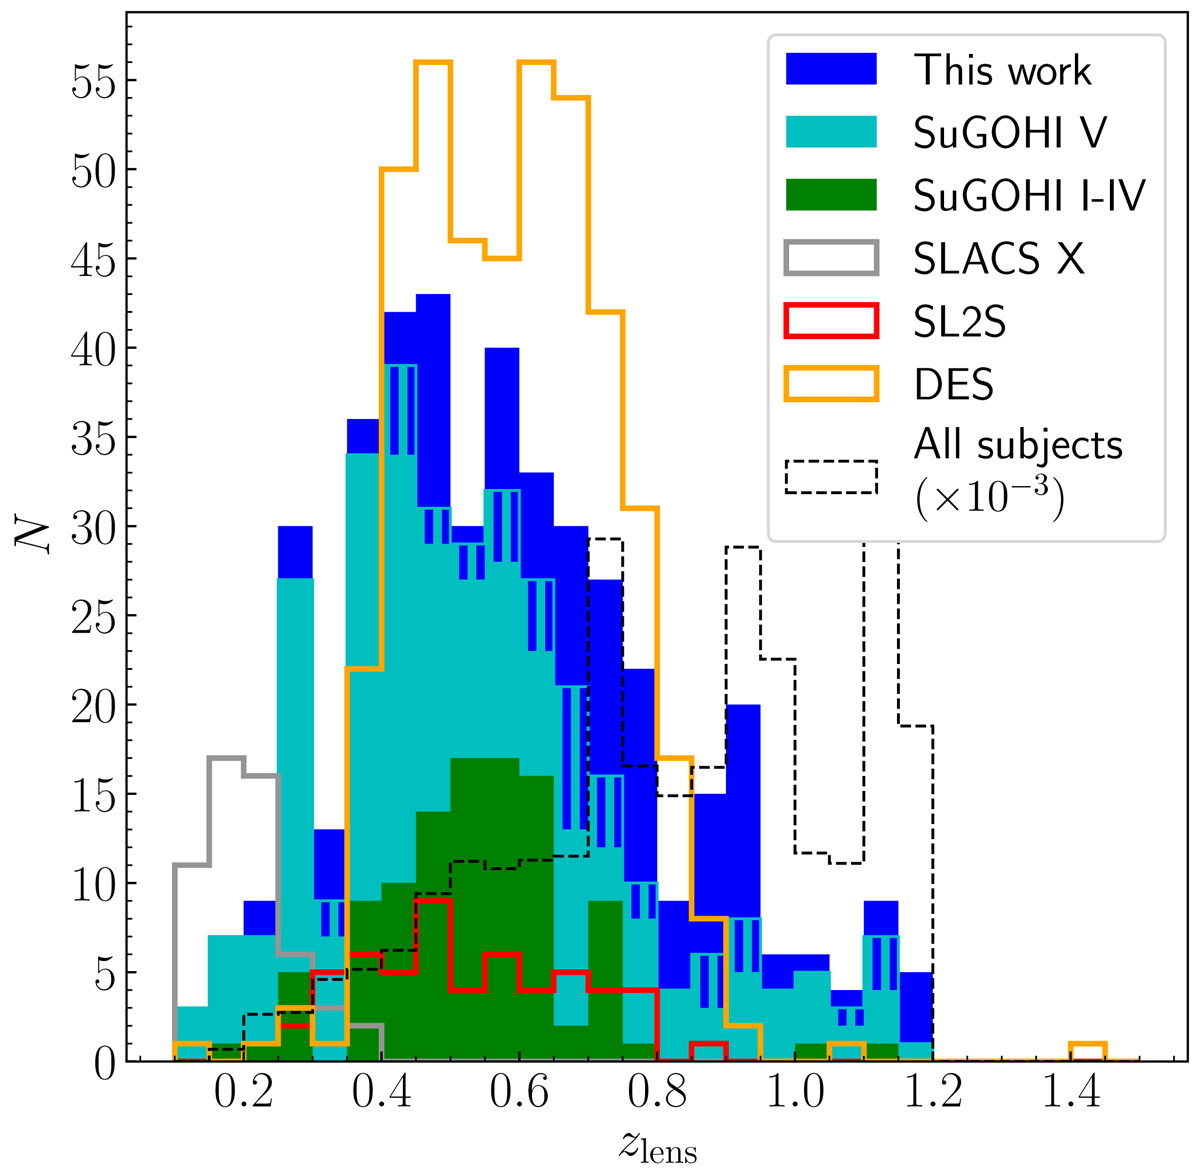
Shaded region: distribution in lens photometric redshift of all grade A and B SuGOHI lenses. The blue portion of the histogram corresponds to lenses discovered in this study. The green part indicates BOSS galaxy lenses discovered with YATTALENS, presented in Paper I, II, and IV (Sonnenfeld et al. 2018; Wong et al. 2019; Chan et al. 2020). The cyan part shows lenses discovered by means of visual inspection of galaxy clusters, as presented in Paper V. The striped regions indicate lenses discovered independently in this study and in the study of Paper V. Grey solid lines: distribution in lens spectroscopic redshift of lenses from the Sloan ACS Lens Survey (SLACS, Auger et al. 2010). Red solid lines: distribution in lens spectroscopic redshift of lenses from the SL2S Survey (Sonnenfeld et al. 2013b,a, 2015). Orange solid lines: distribution in lens photometric redshift of likely lenses discovered in DES by Jacobs et al. (2019). Dashed lines: distribution in photometric redshift of all subjects examined in this study, rescaled downwards by a factor of 1000.
Current usage metrics show cumulative count of Article Views (full-text article views including HTML views, PDF and ePub downloads, according to the available data) and Abstracts Views on Vision4Press platform.
Data correspond to usage on the plateform after 2015. The current usage metrics is available 48-96 hours after online publication and is updated daily on week days.
Initial download of the metrics may take a while.