Free Access
Fig. 5.
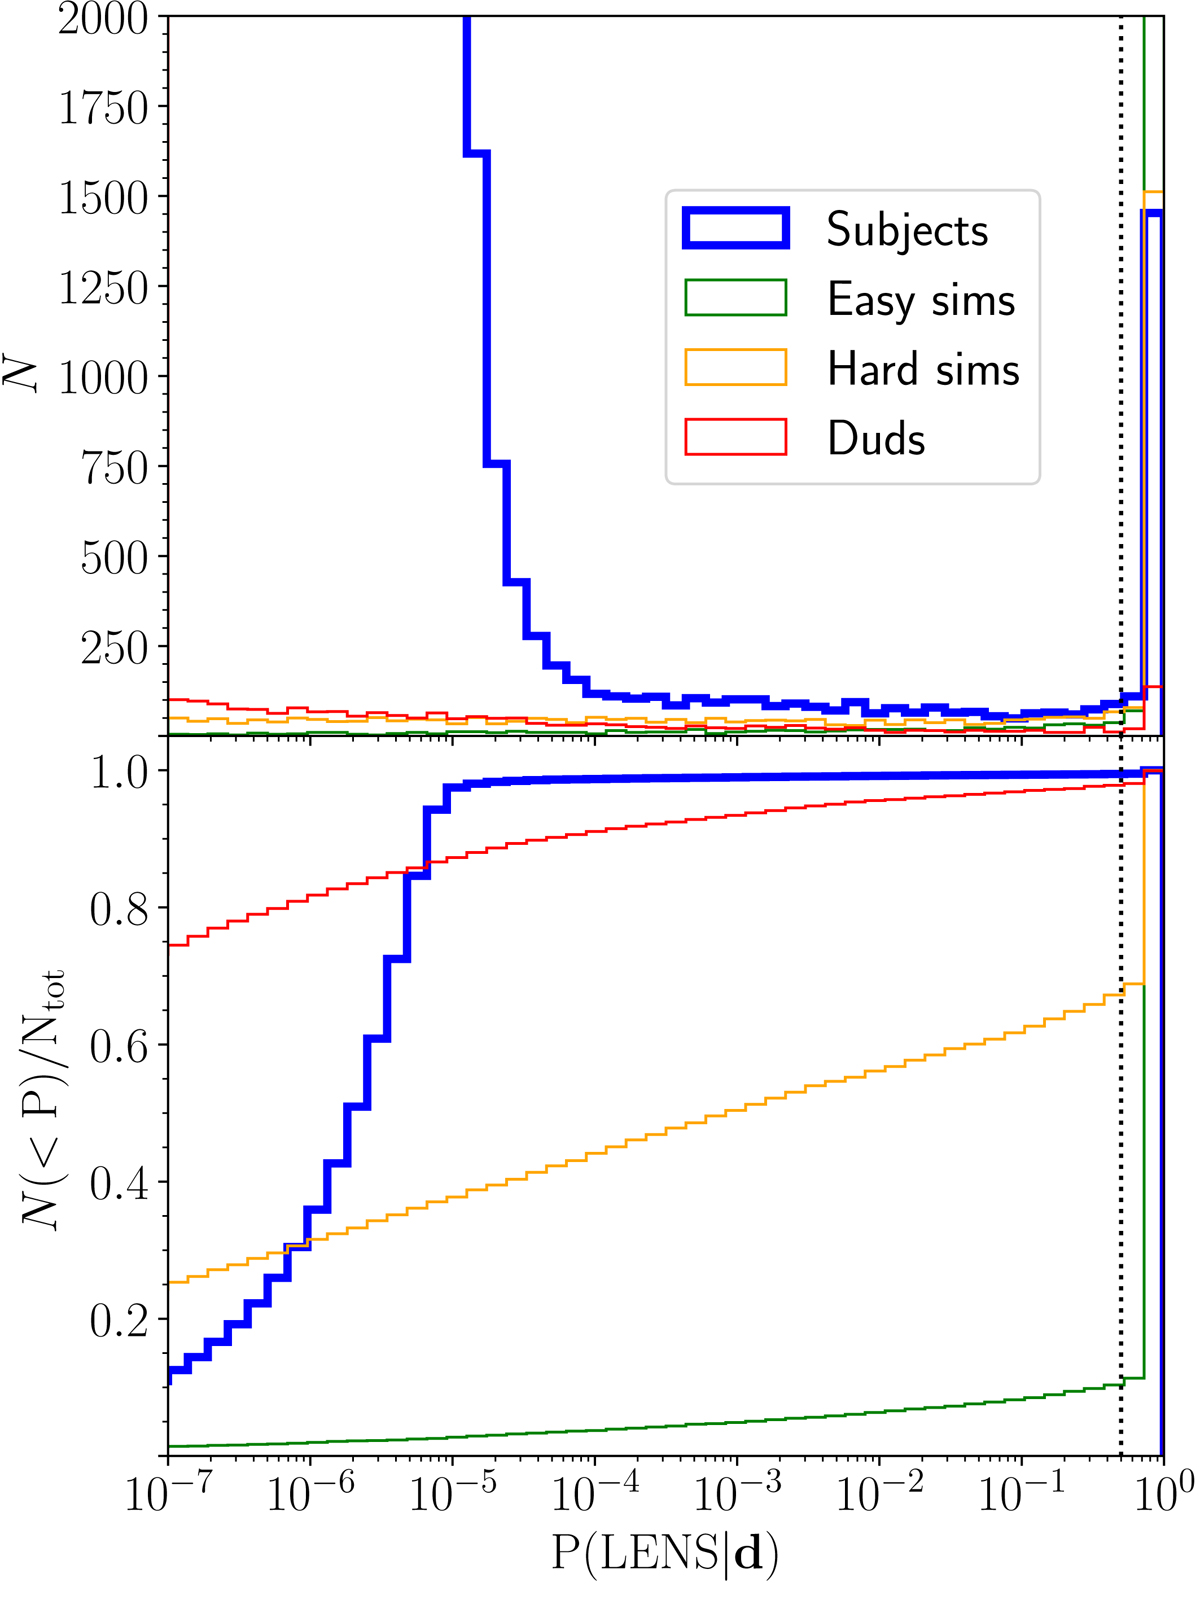
Top: distribution in the posterior probability of subjects, duds, and sims being lenses given the classification data from the volunteers. Bottom: cumulative distribution. The vertical dotted line marks the limit above which subjects are declared promising candidates and promoted to the expert visual inspection step.
Current usage metrics show cumulative count of Article Views (full-text article views including HTML views, PDF and ePub downloads, according to the available data) and Abstracts Views on Vision4Press platform.
Data correspond to usage on the plateform after 2015. The current usage metrics is available 48-96 hours after online publication and is updated daily on week days.
Initial download of the metrics may take a while.