Fig. 7.
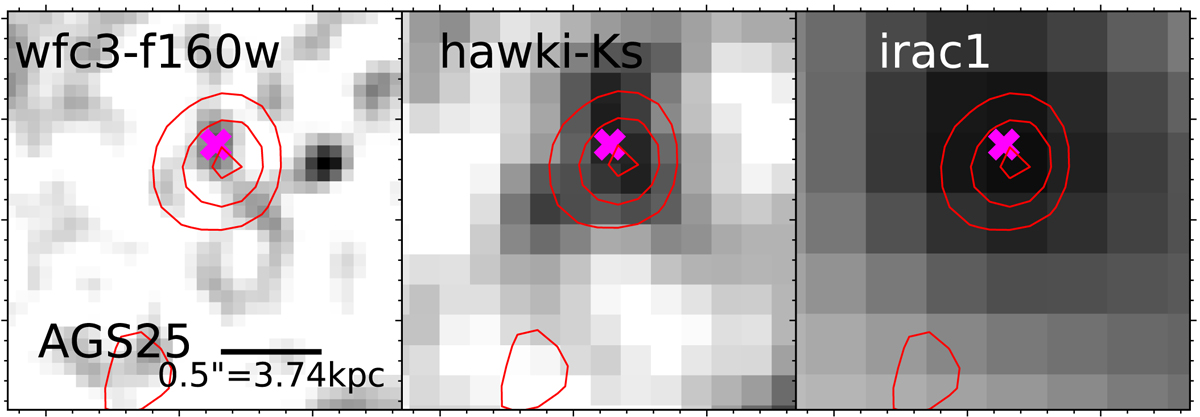
Images of AGS25 in the H-band (1.6 μm), Ks-band (2.2 μm) and IRAC1-band (3.6 μm). The contribution of a 3″distant bright neighbor of AGS25 was subtracted to produce the IRAC image as in F20a. The red contours denote the ALMA detection at 1.1 mm at the resolution of 0![]() 60. The magenta “x” is the ZFOURGE counterpart IDZFOURGE = 11 353.
60. The magenta “x” is the ZFOURGE counterpart IDZFOURGE = 11 353.
Current usage metrics show cumulative count of Article Views (full-text article views including HTML views, PDF and ePub downloads, according to the available data) and Abstracts Views on Vision4Press platform.
Data correspond to usage on the plateform after 2015. The current usage metrics is available 48-96 hours after online publication and is updated daily on week days.
Initial download of the metrics may take a while.