Fig. 2.
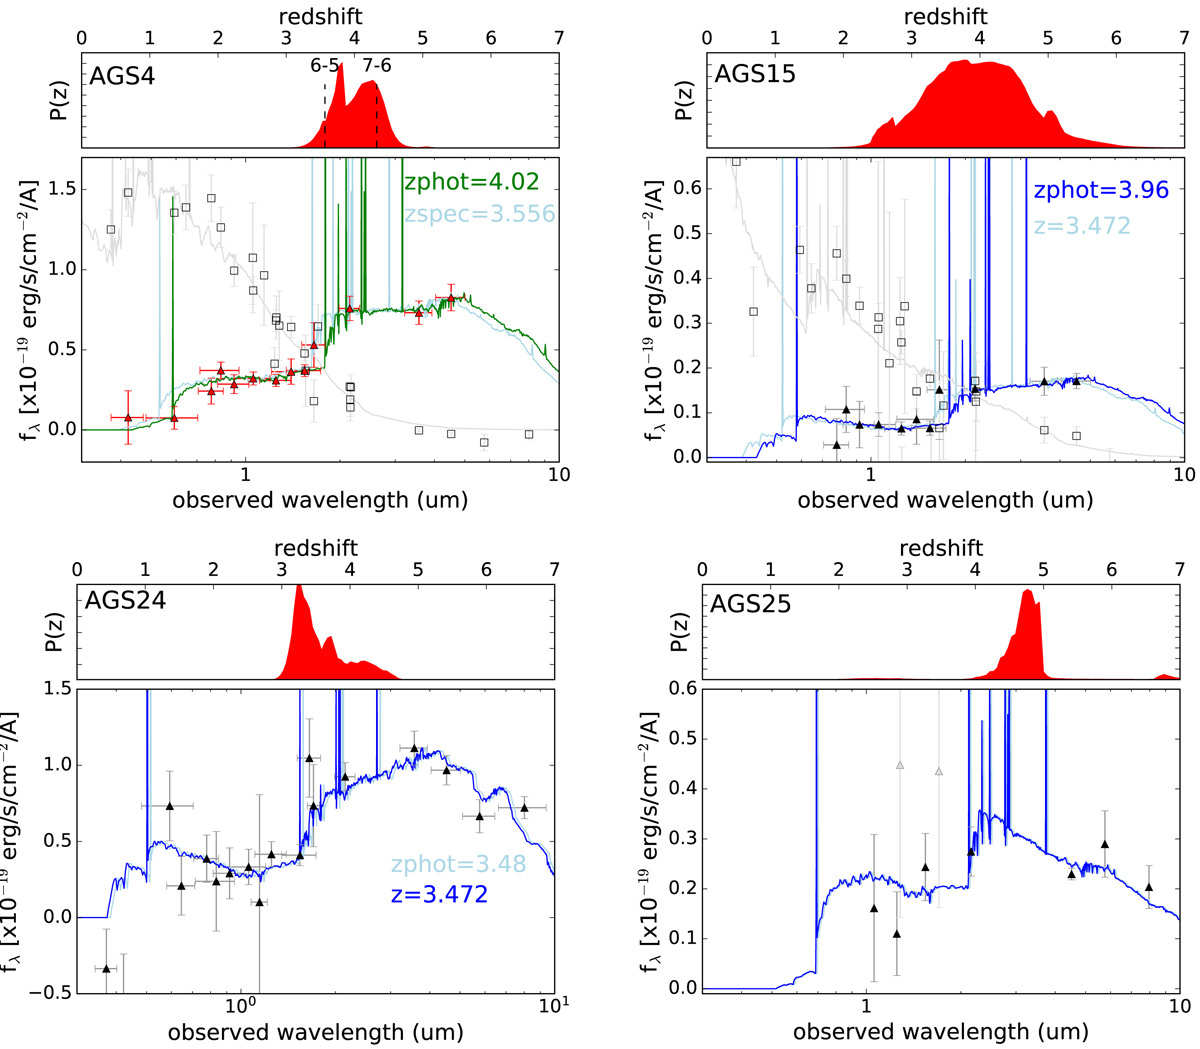
Top-left: SED of AGS4. Top: photometric redshift PDF derived by EAzY (Brammer et al. 2008). Bottom: SED fittings. The green curve shows the best-fit of AGS4 at zphot = 4.02 using EAzY, and we shift the SED to the spectroscopic redshift (zspec = 3.556) of AGS4 in light blue for comparison. The gray curve shows the SED of the optically bright neighbor, IDZFOURGE = 12 333. Top-right: SED of AGS15. The blue curve shows the best-fit at zphot = 3.96 derived by EAzY and we shift the SED to the redshift peak of the overdensity, at z = 3.472, in light blue for comparison. The gray curve shows the SED of the optically bright neighbor, IDCANDELS = 3818. Bottom-left: SED of AGS24. Same as AGS15. Bottom-right: SED of AGS25 at zphot = 4.70, fitted by EAzY with the photometry retrieved from the ZFOURGE catalog.
Current usage metrics show cumulative count of Article Views (full-text article views including HTML views, PDF and ePub downloads, according to the available data) and Abstracts Views on Vision4Press platform.
Data correspond to usage on the plateform after 2015. The current usage metrics is available 48-96 hours after online publication and is updated daily on week days.
Initial download of the metrics may take a while.