Free Access
Fig. 13.
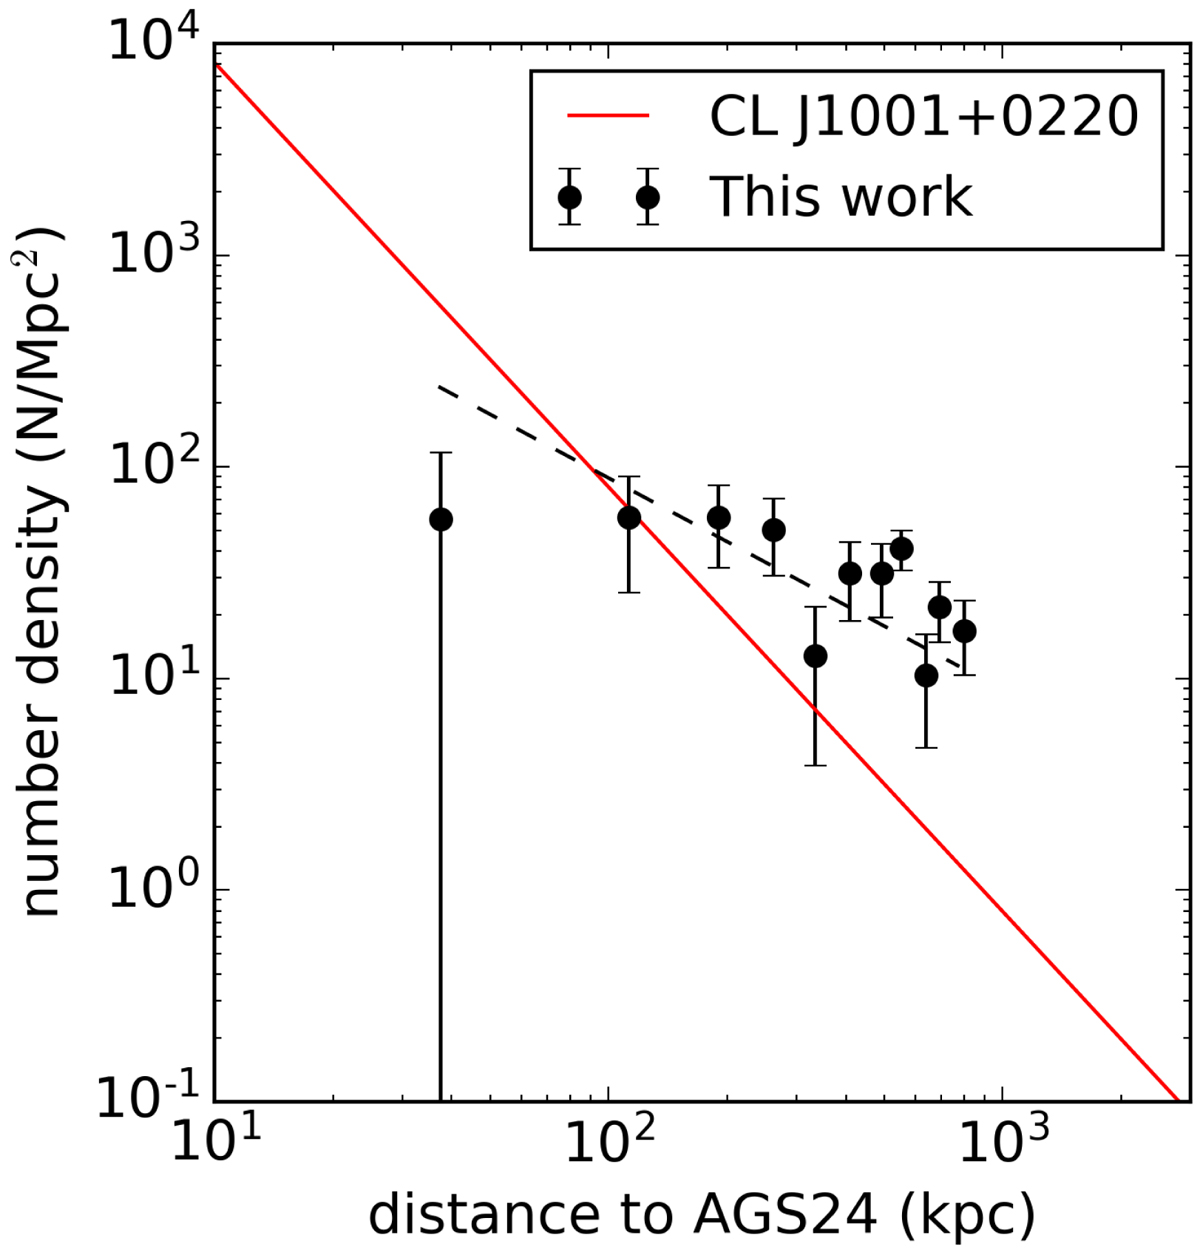
Projected numbers of galaxies in the overdensity as a function of their distance to AGS24 (black circles) and the black dashed line is the linear fitting to the profile. The red line shows the best-fit projected NFW profile (Navarro et al. 1996) of a galaxy cluster at z = 2.506, CL J1001+0220 (Wang et al. 2016).
Current usage metrics show cumulative count of Article Views (full-text article views including HTML views, PDF and ePub downloads, according to the available data) and Abstracts Views on Vision4Press platform.
Data correspond to usage on the plateform after 2015. The current usage metrics is available 48-96 hours after online publication and is updated daily on week days.
Initial download of the metrics may take a while.