Free Access
Fig. 11.
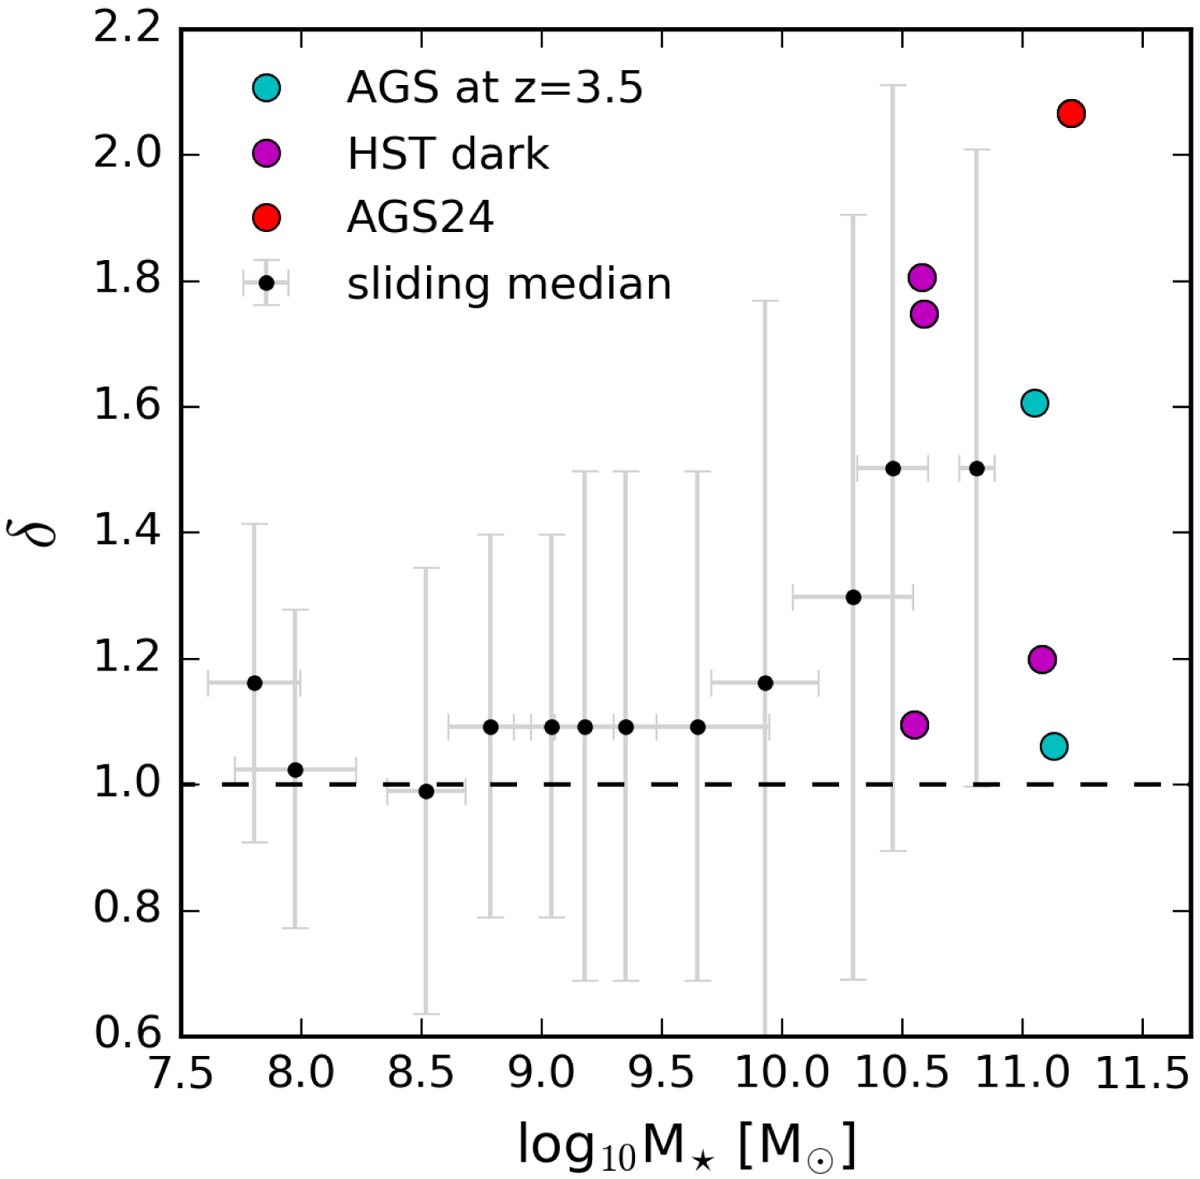
Local overdensity (δ) of individual galaxies in the GOODS-ALMA field at 3.42 < z < 3.57. The black dots show the sliding medians of δ at different stellar masses. The filled circles indicate all the ALMA detections. The purple circles are the HST dark galaxies and the red circle indicates AGS24.
Current usage metrics show cumulative count of Article Views (full-text article views including HTML views, PDF and ePub downloads, according to the available data) and Abstracts Views on Vision4Press platform.
Data correspond to usage on the plateform after 2015. The current usage metrics is available 48-96 hours after online publication and is updated daily on week days.
Initial download of the metrics may take a while.