Fig. 8
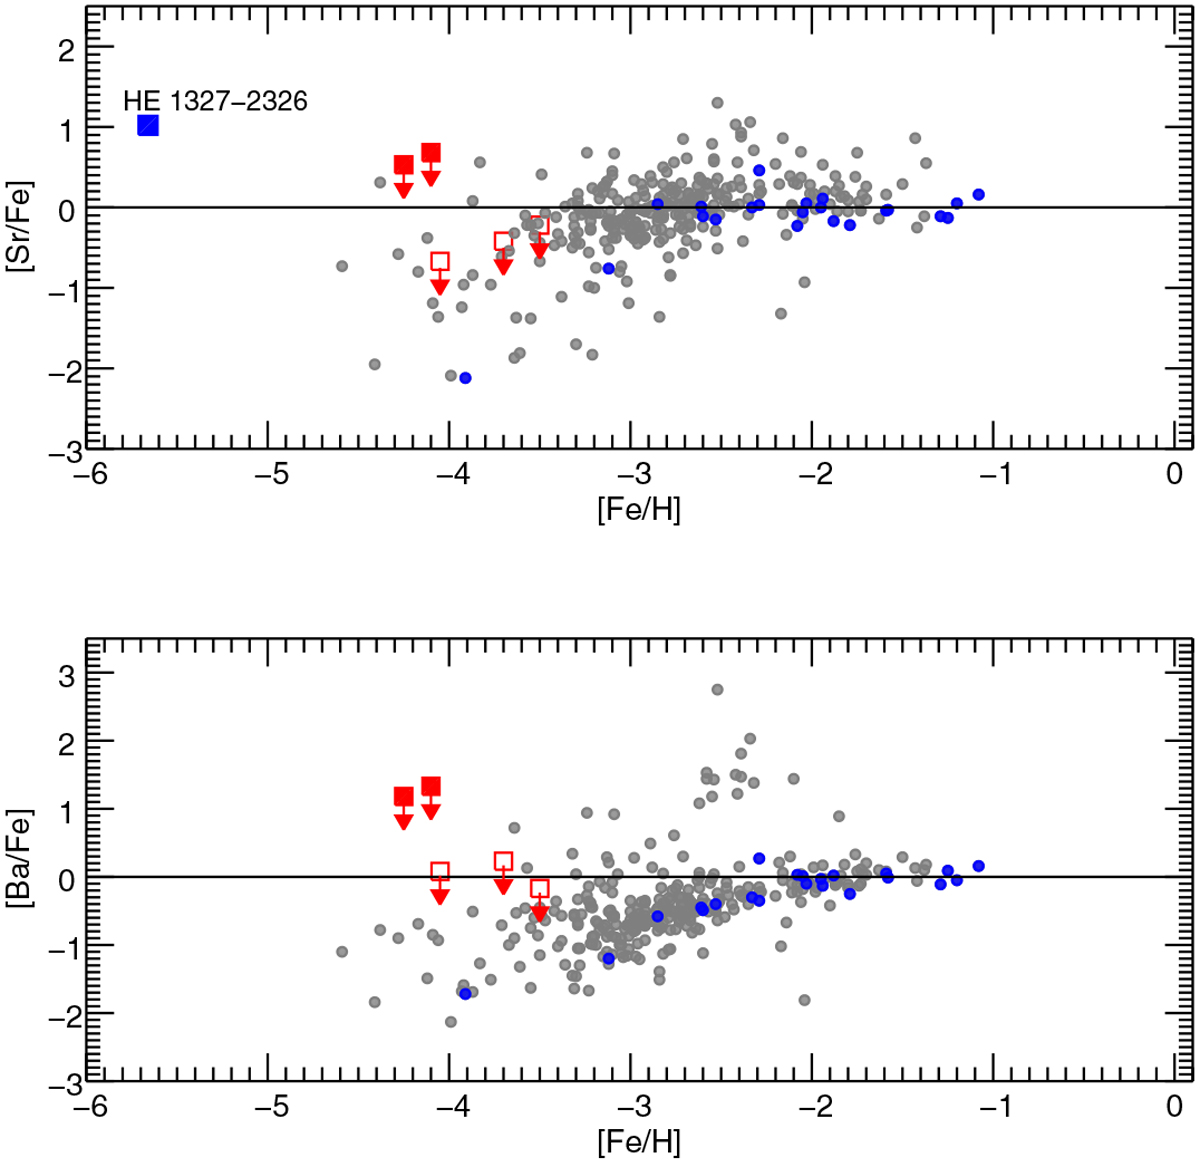
Sr/Fe] and [Ba/Fe] vs. [Fe/H]. Red squares indicate results from the present study. Open red squares represent the stars for which we find low [n-capture/Fe] upper limit abundances. Grey circles show evolved stars from Roederer et al. (2014), blue circles indicate main sequence stars from Roederer et al. (2014), and the blue rectangle represents HE1327-2326, a star with an exceptionally high [Sr/Fe] ratio (Frebel et al. 2008; Aoki et al. 2006).
Current usage metrics show cumulative count of Article Views (full-text article views including HTML views, PDF and ePub downloads, according to the available data) and Abstracts Views on Vision4Press platform.
Data correspond to usage on the plateform after 2015. The current usage metrics is available 48-96 hours after online publication and is updated daily on week days.
Initial download of the metrics may take a while.