Fig. 5
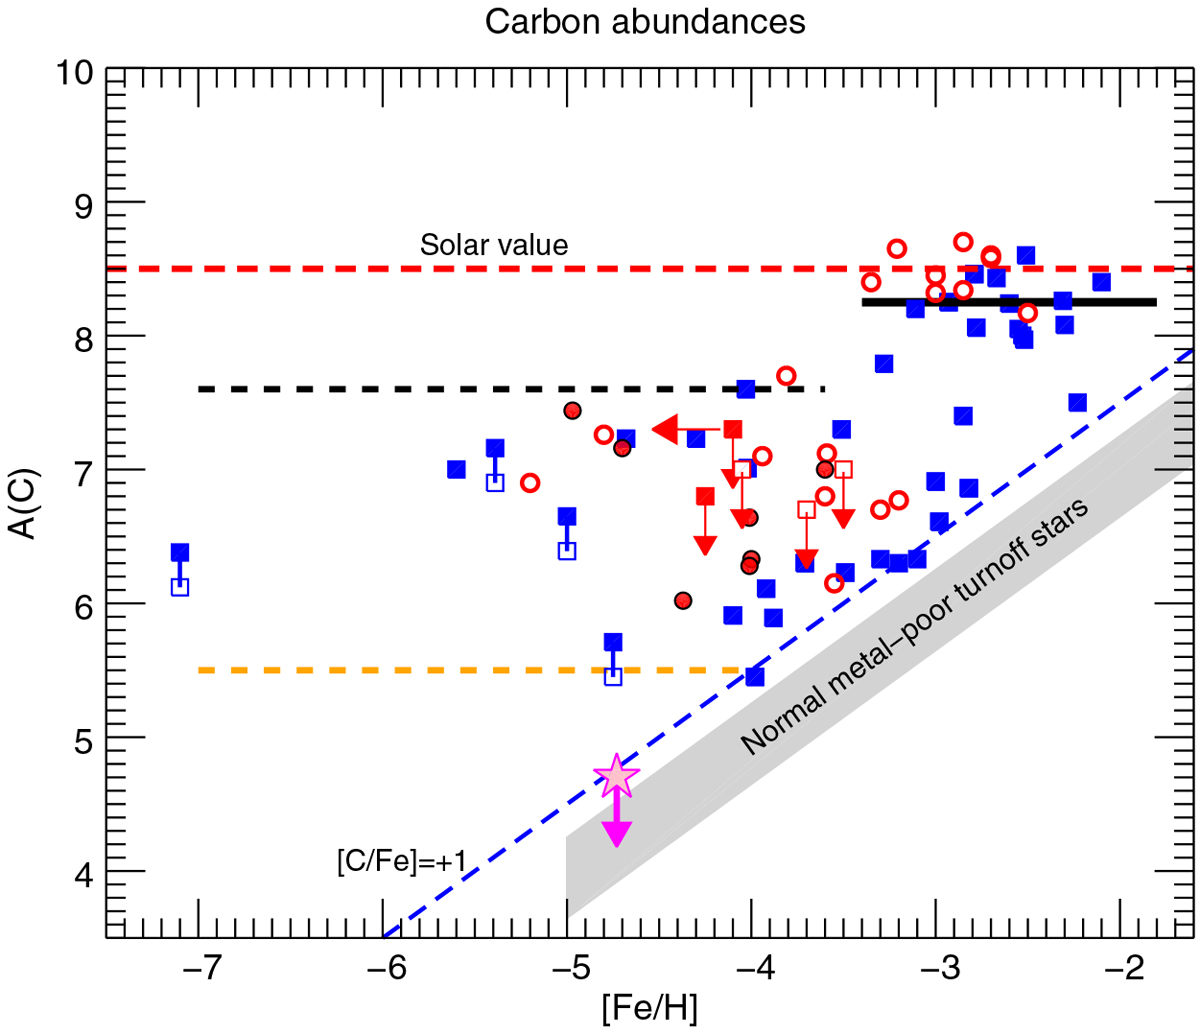
Carbon abundances A(C) of CEMP stars as a function of [Fe/H]. Large filled red squares represent our results. Downward-pointing arrows indicate that the abundances are given as upper limits. Open red symbols represent the stars for which we find low [n-capture/Fe] upper limit abundances. Open and filled red circles are data published by our group. Other stars from the literature are represented as blue squares (see main text for details). Open blue squares are carbon abundances derived using 3D corrections from Gallagher et al. (2016). Black circles filled in red are stars from Bonifacio et al. (2018). The pink symbol represents SDSS J102915+17292, the normal-carbon, ultra metal-poor star discovered by Caffau et al. (2011a). The other symbols are literature data. The black and yellow dashed lines delimit the low-carbon band. Details can be found in Bonifacio et al. (2018).
Current usage metrics show cumulative count of Article Views (full-text article views including HTML views, PDF and ePub downloads, according to the available data) and Abstracts Views on Vision4Press platform.
Data correspond to usage on the plateform after 2015. The current usage metrics is available 48-96 hours after online publication and is updated daily on week days.
Initial download of the metrics may take a while.