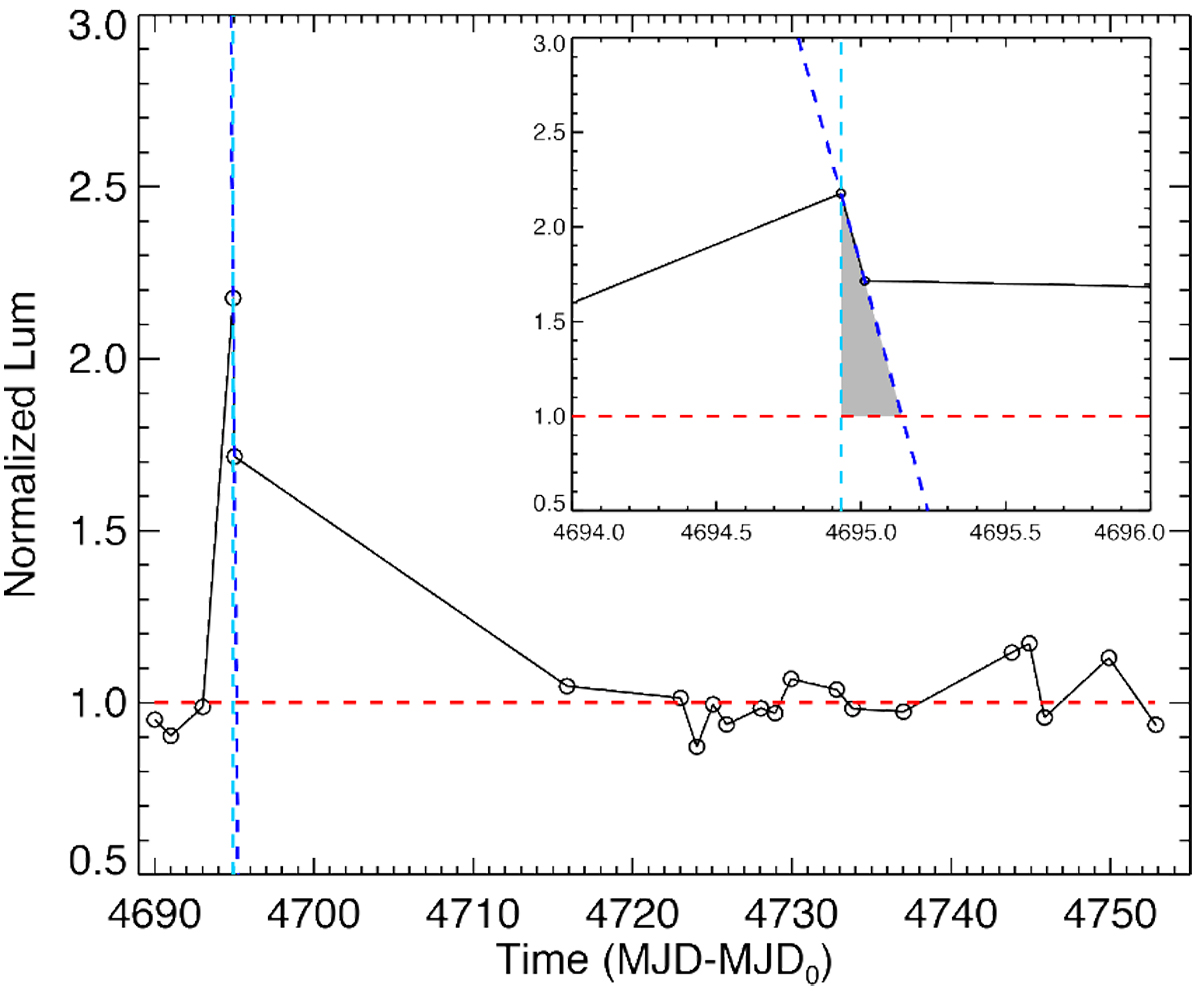
Fig. B.1

Example of the triangle used to calculate the energy released during the flare in a given line. The dashed light blue line, parallel to the ordinate axis and passing through the point of flare maximum, represents the rising phase of the flare; the dashed blue line, passing through the two points corresponding to the two observations performed two hours apart, approximate the decay phase of the flare. The dashed red line shows the quiescent state of the star. MJD0 = 53758.244, time of the first observation obtained in 2006. The inset shows the zoom-in on the triangle.
Current usage metrics show cumulative count of Article Views (full-text article views including HTML views, PDF and ePub downloads, according to the available data) and Abstracts Views on Vision4Press platform.
Data correspond to usage on the plateform after 2015. The current usage metrics is available 48-96 hours after online publication and is updated daily on week days.
Initial download of the metrics may take a while.


