Fig. A.1
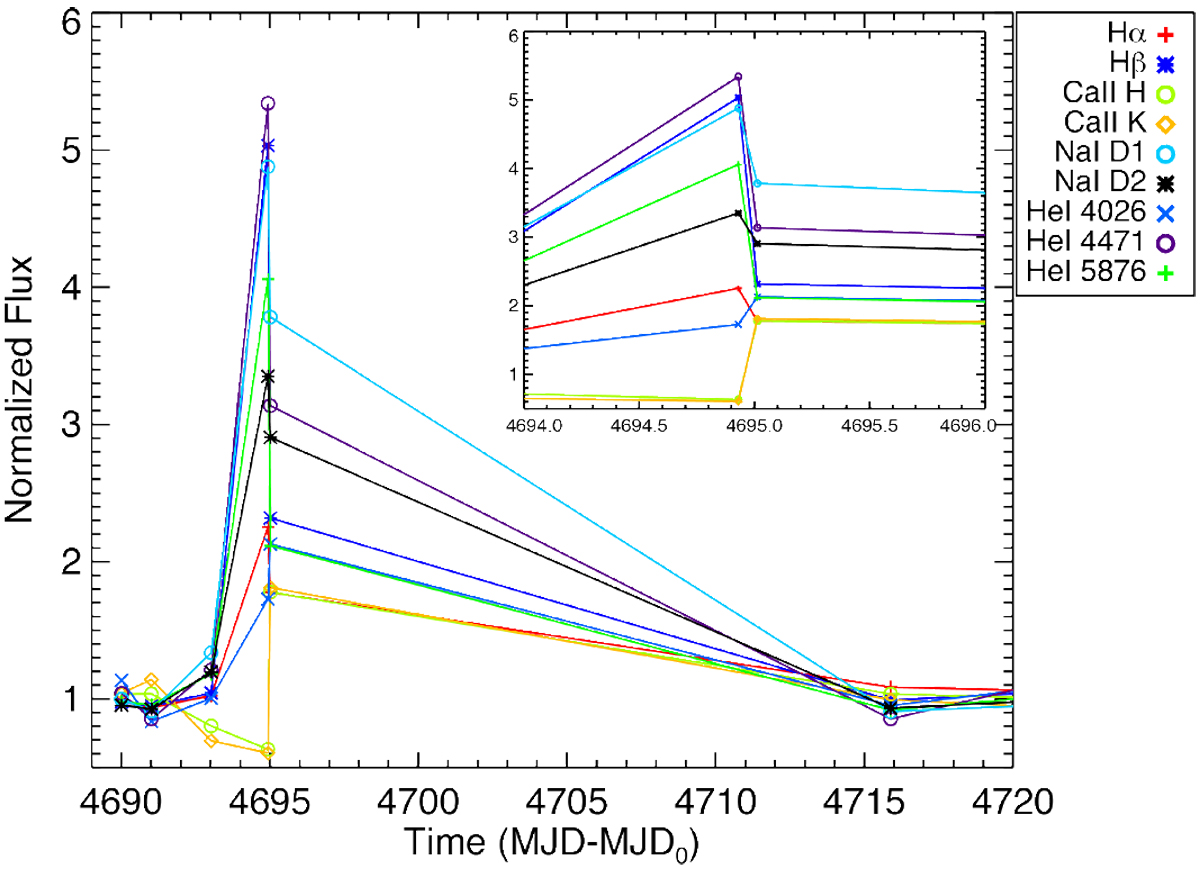
Time series of normalised flux of analysed activity indicators to evidence the flare. MJD0 = 53758.244, time of the first observation obtained in 2006. The inset shows the zoom of the time series during the flares. Shown is the delay onthe flare event in the Ca II H and K lines and in He I at 4026 Å. Also shown are the pre-flare dips on the time series of these indicators.
Current usage metrics show cumulative count of Article Views (full-text article views including HTML views, PDF and ePub downloads, according to the available data) and Abstracts Views on Vision4Press platform.
Data correspond to usage on the plateform after 2015. The current usage metrics is available 48-96 hours after online publication and is updated daily on week days.
Initial download of the metrics may take a while.