Free Access
Fig. 4
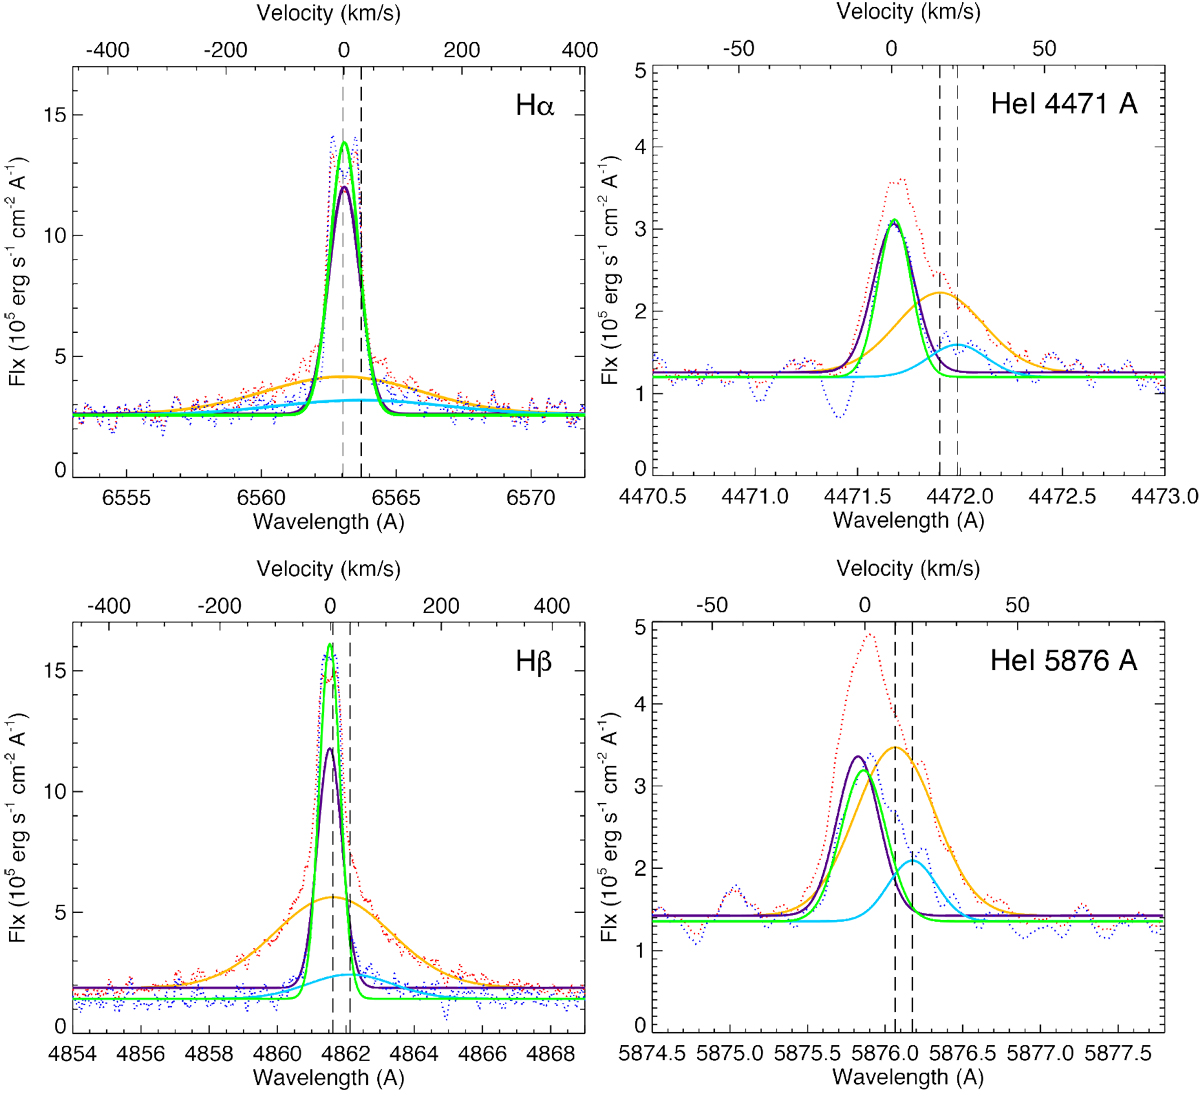
Spectrum ID 79 for the flare’s maximum phase (red dotted line) and spectrum ID 80 for the decay phase (blue dotted line).Gaussian fit with broad and narrow components, respectively in orange and purple for ID 79 and in green and light blue for ID 80. The black dashed line shows the centre of each broad component.
Current usage metrics show cumulative count of Article Views (full-text article views including HTML views, PDF and ePub downloads, according to the available data) and Abstracts Views on Vision4Press platform.
Data correspond to usage on the plateform after 2015. The current usage metrics is available 48-96 hours after online publication and is updated daily on week days.
Initial download of the metrics may take a while.