Fig. 2
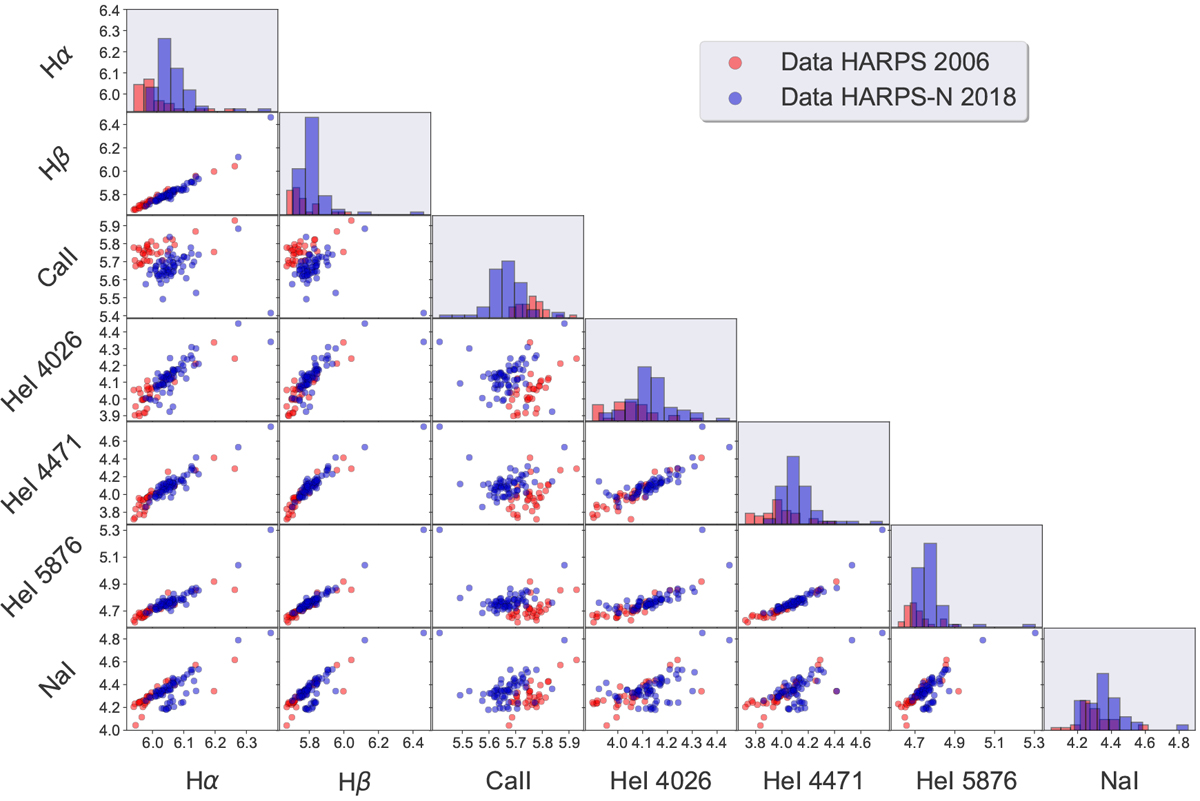
Correlation plot of flux (logarithmic scale) between different activity indicators. The diagonal panels show the histogram of flux of each indicator. It can be seen that most of the indicators show a significant correlation in both the datasets. Correlations with Ca II are less significant and more scattered. This figure also shows less activity of the star in 2006 (red points) than in 2018 (blue points). However, the flux of Ca II is higher in 2006 than in 2018. This result can be interpreted as a major surface coverage of plages and filaments during the observations in 2006.
Current usage metrics show cumulative count of Article Views (full-text article views including HTML views, PDF and ePub downloads, according to the available data) and Abstracts Views on Vision4Press platform.
Data correspond to usage on the plateform after 2015. The current usage metrics is available 48-96 hours after online publication and is updated daily on week days.
Initial download of the metrics may take a while.