Fig. 1
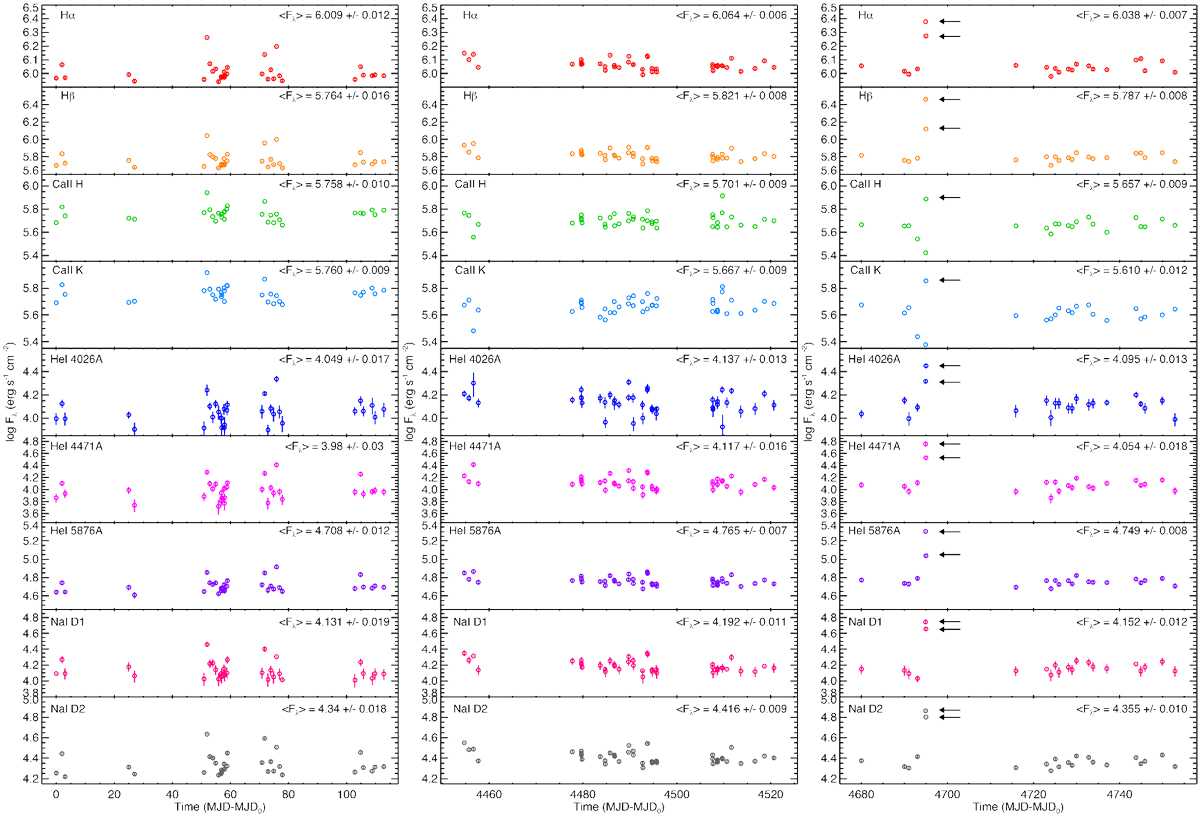
Line flux vs. time (MJD0 is the start time of observations in 2006). Data obtained in 2006 are shown in the left panel. Data obtained in 2018 are shown in the middle and right panels. ⟨Fλ ⟩ is the average of the logarithmic flux of each activity indicator for each season (for the second season of 2018 these values exclude the flare event points). Black arrows mark the points relative to the flare event. The error bars are shown in the plots, but for most of the points are too small to be visible.
Current usage metrics show cumulative count of Article Views (full-text article views including HTML views, PDF and ePub downloads, according to the available data) and Abstracts Views on Vision4Press platform.
Data correspond to usage on the plateform after 2015. The current usage metrics is available 48-96 hours after online publication and is updated daily on week days.
Initial download of the metrics may take a while.