Fig. 2
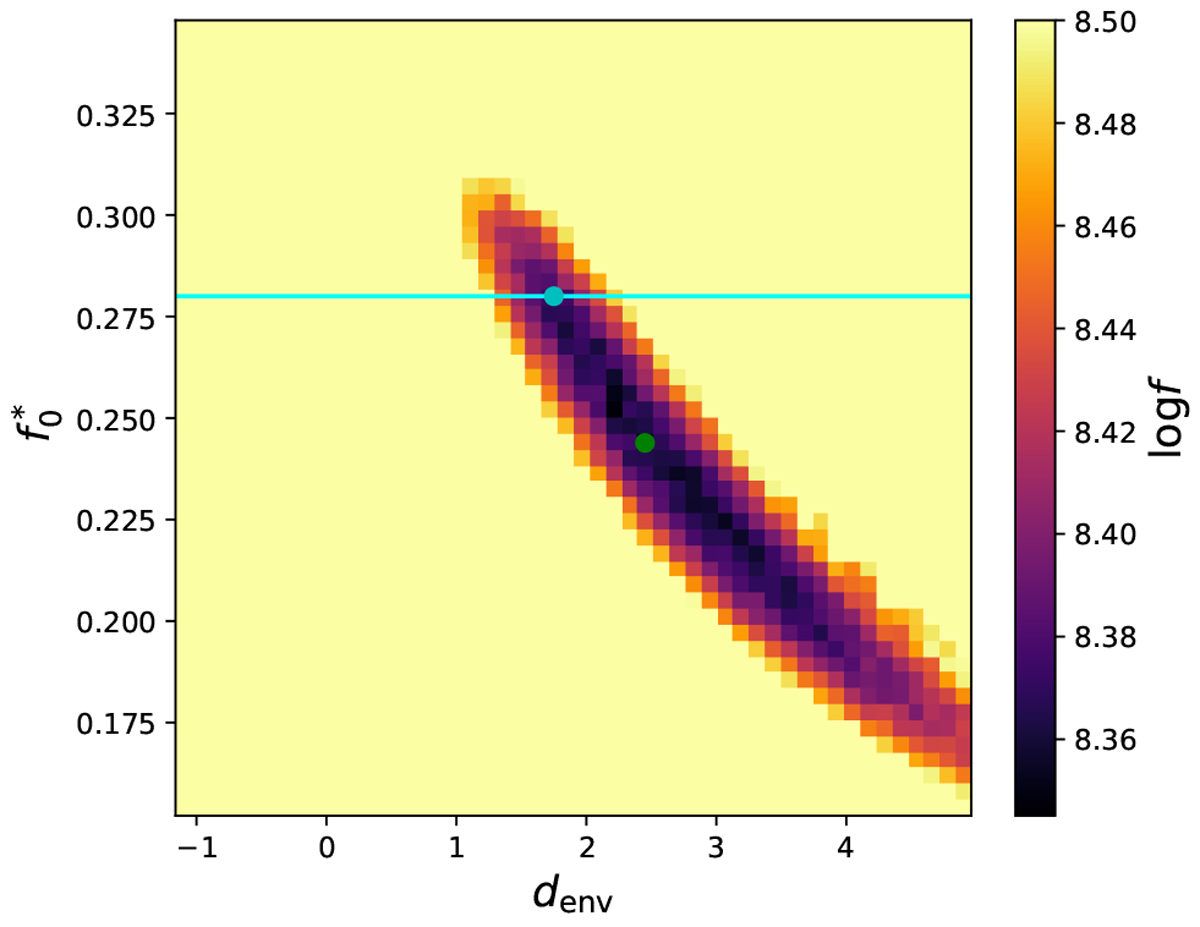
Logarithm of the cost function f as a function of the chromatic parameters ![]() and denv. The green circle represents the pair of chromatic parameters where the cost-function value is the smallest. The cyan horizontal line is the stellar-to-total flux ratio from the best-fit geometrical model (
and denv. The green circle represents the pair of chromatic parameters where the cost-function value is the smallest. The cyan horizontal line is the stellar-to-total flux ratio from the best-fit geometrical model (![]() = 0.28). The cyan circle is the pair of chromatic parameters giving the most likely image reconstruction using
= 0.28). The cyan circle is the pair of chromatic parameters giving the most likely image reconstruction using
![]() from the geometrical model fitting.
from the geometrical model fitting.
Current usage metrics show cumulative count of Article Views (full-text article views including HTML views, PDF and ePub downloads, according to the available data) and Abstracts Views on Vision4Press platform.
Data correspond to usage on the plateform after 2015. The current usage metrics is available 48-96 hours after online publication and is updated daily on week days.
Initial download of the metrics may take a while.