Fig. 7.
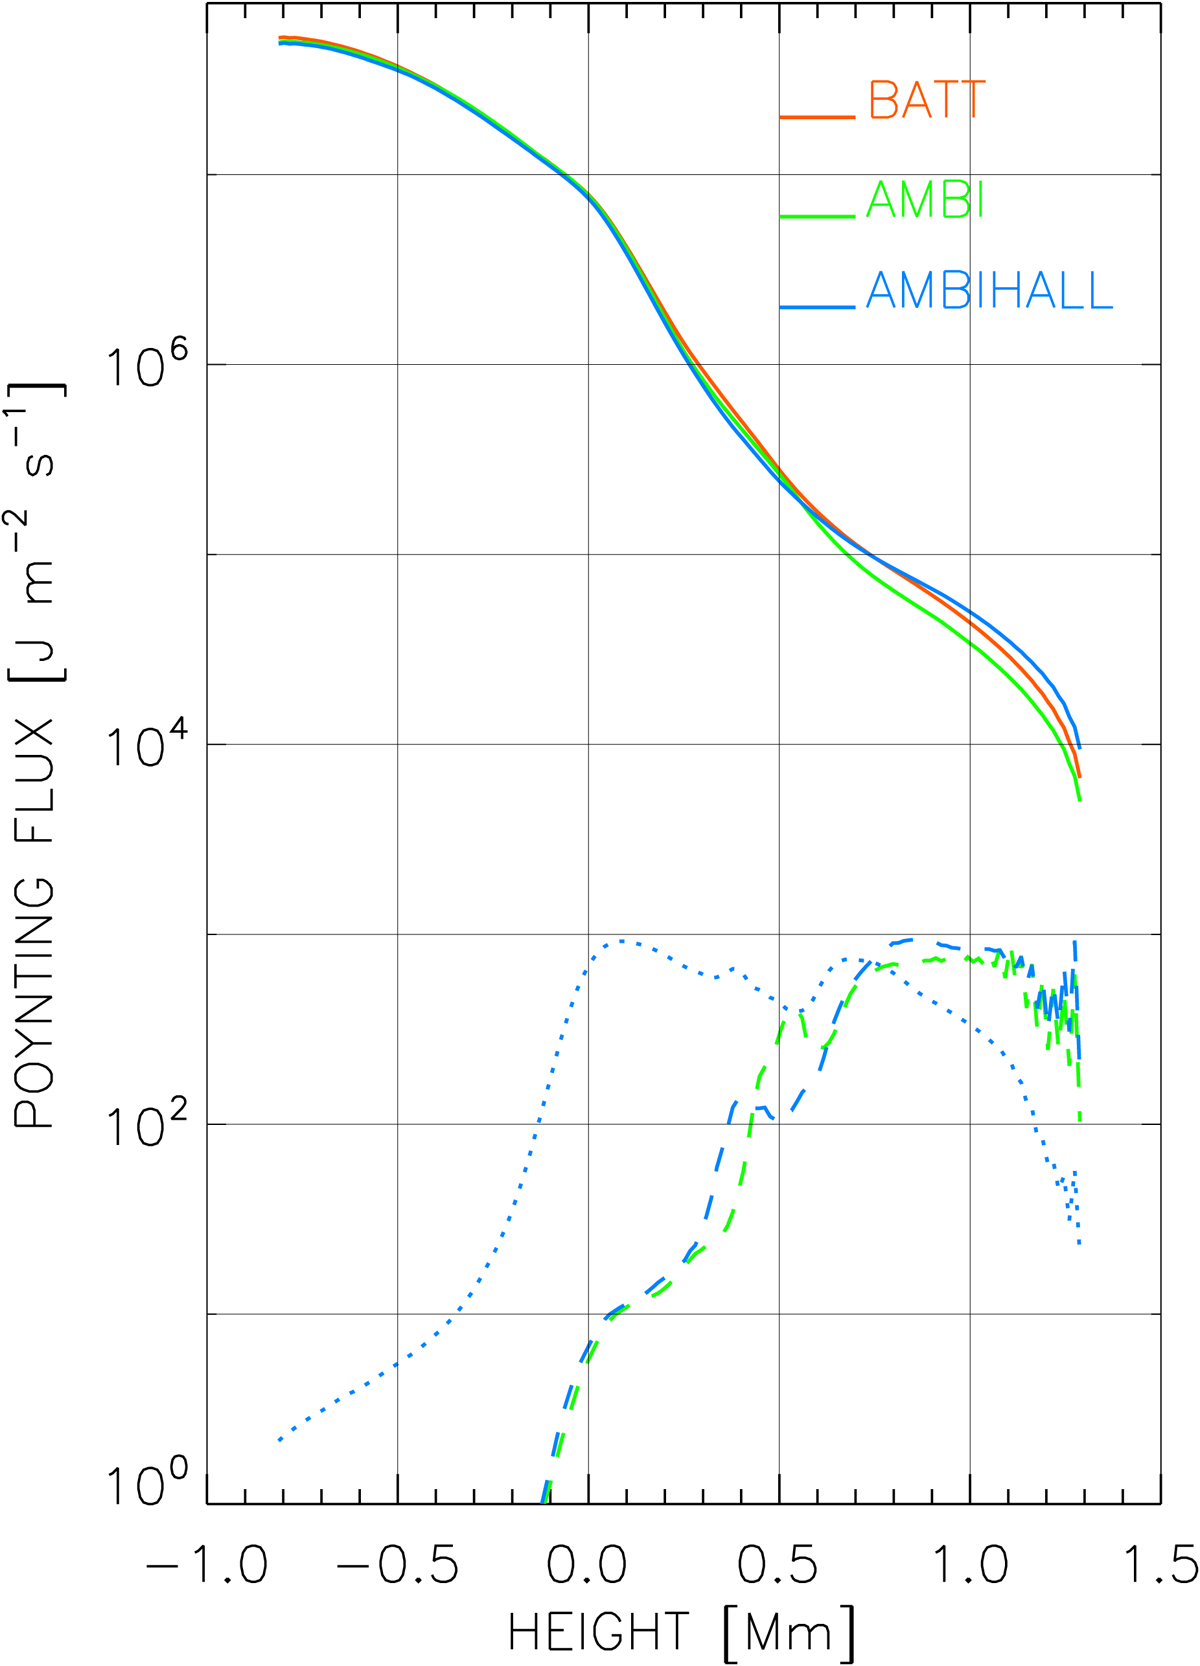
Solid lines: total magnitude of the vertical component of the ideal Poynting flux, ![]() , as a function of height for the BATT (red), AMBI (green), and AMBIHALL (blue) cases. Dashed lines show the total magnitude of the vertical component of the ambipolar contribution from Eq. (12) for the AMBI model (green) and AMBIHALL model (blue). Dotted blue line shows the total magnitude of the vertical component of the Hall contribution.
, as a function of height for the BATT (red), AMBI (green), and AMBIHALL (blue) cases. Dashed lines show the total magnitude of the vertical component of the ambipolar contribution from Eq. (12) for the AMBI model (green) and AMBIHALL model (blue). Dotted blue line shows the total magnitude of the vertical component of the Hall contribution.
Current usage metrics show cumulative count of Article Views (full-text article views including HTML views, PDF and ePub downloads, according to the available data) and Abstracts Views on Vision4Press platform.
Data correspond to usage on the plateform after 2015. The current usage metrics is available 48-96 hours after online publication and is updated daily on week days.
Initial download of the metrics may take a while.