Fig. 14.
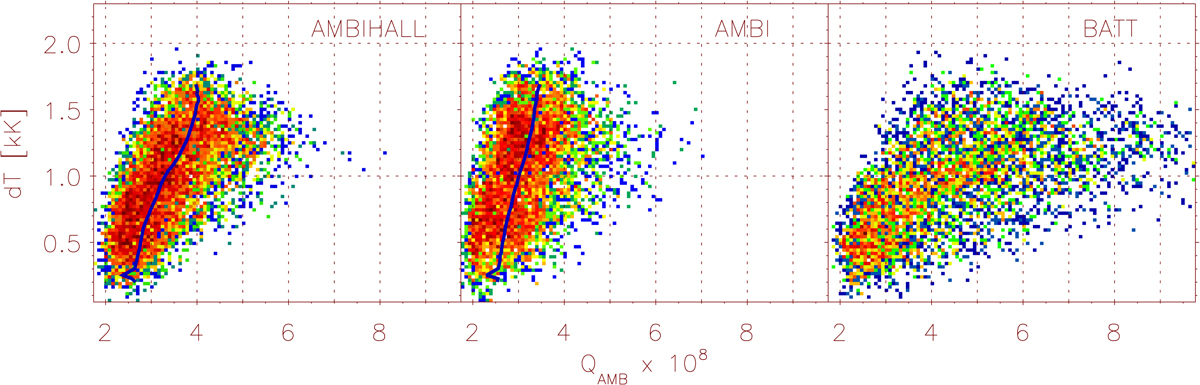
Two-dimensional histograms showing the relation between the mean temperature difference between the two snapshots separated 100 s in time, and the mean ambipolar heating rate, QAMB at heights between 0.56 Mm and 1.1 Mm and at locations where QAMB exceeds a certain value. The progressively more red colors indicate a progressively larger number of points in a given interval of values of dT and QAMB.
Current usage metrics show cumulative count of Article Views (full-text article views including HTML views, PDF and ePub downloads, according to the available data) and Abstracts Views on Vision4Press platform.
Data correspond to usage on the plateform after 2015. The current usage metrics is available 48-96 hours after online publication and is updated daily on week days.
Initial download of the metrics may take a while.