Fig. 10.
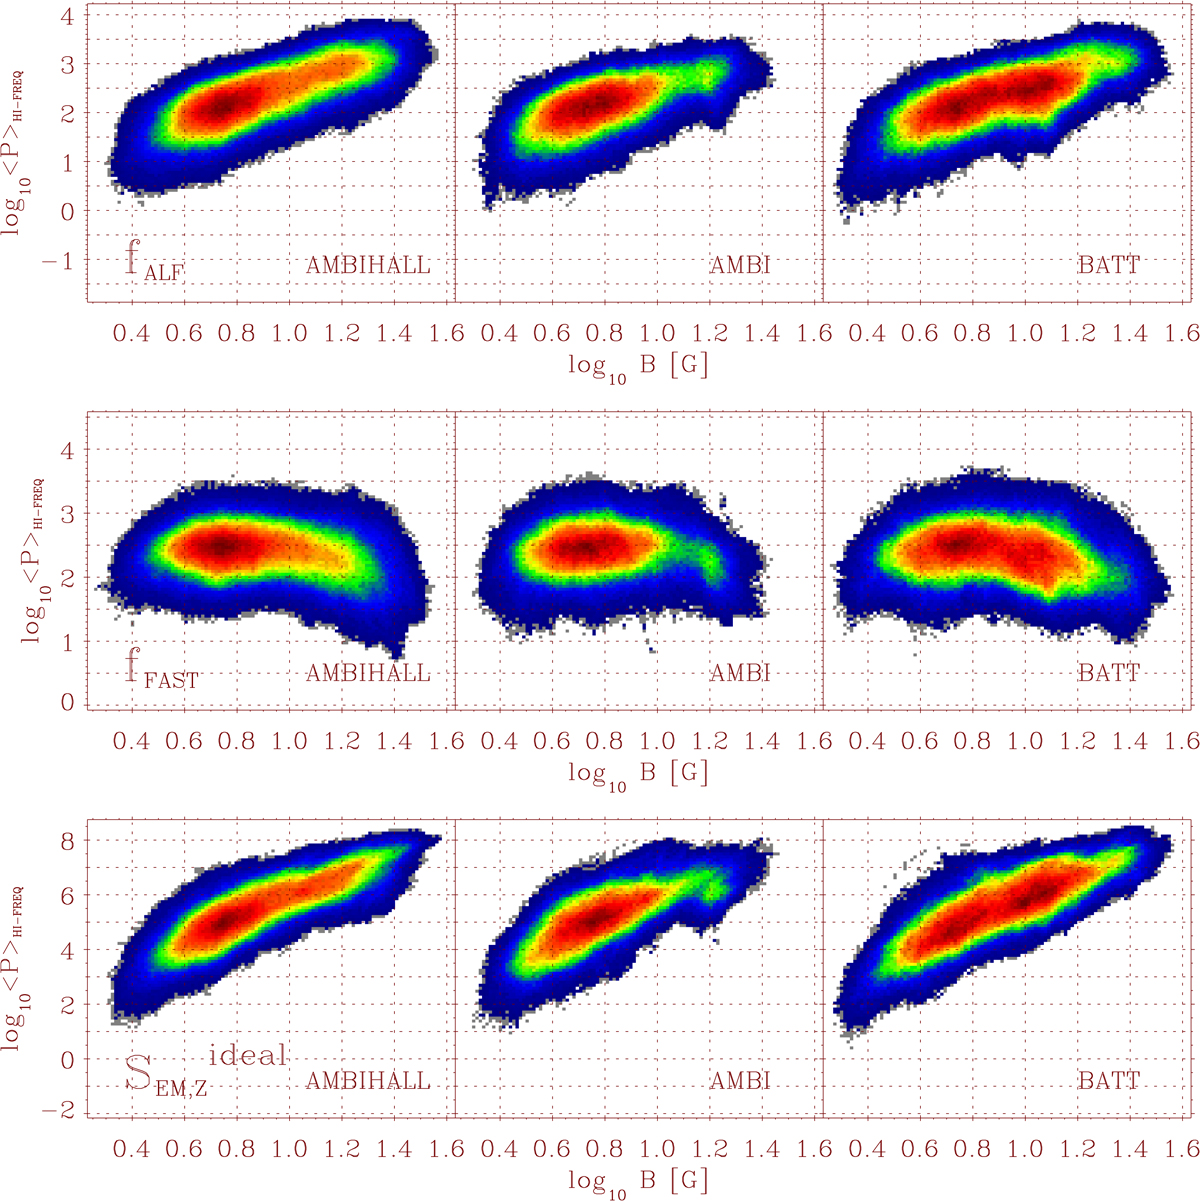
Two-dimensional histograms showing the dependence on magnetic field strength, B, of the power of falf (top), ffast (middle), and ![]() (bottom). The progressively more red colors indicate a progressively larger number of points in a given interval of values of B and the power of the above quantities, in logarithmic units. Only points with plasma-β below 10 and with magnetic field inclination θ < 40° at heights between 1.1 and 1.3 Mm are selected for the analysis.
(bottom). The progressively more red colors indicate a progressively larger number of points in a given interval of values of B and the power of the above quantities, in logarithmic units. Only points with plasma-β below 10 and with magnetic field inclination θ < 40° at heights between 1.1 and 1.3 Mm are selected for the analysis.
Current usage metrics show cumulative count of Article Views (full-text article views including HTML views, PDF and ePub downloads, according to the available data) and Abstracts Views on Vision4Press platform.
Data correspond to usage on the plateform after 2015. The current usage metrics is available 48-96 hours after online publication and is updated daily on week days.
Initial download of the metrics may take a while.