Fig. 9.
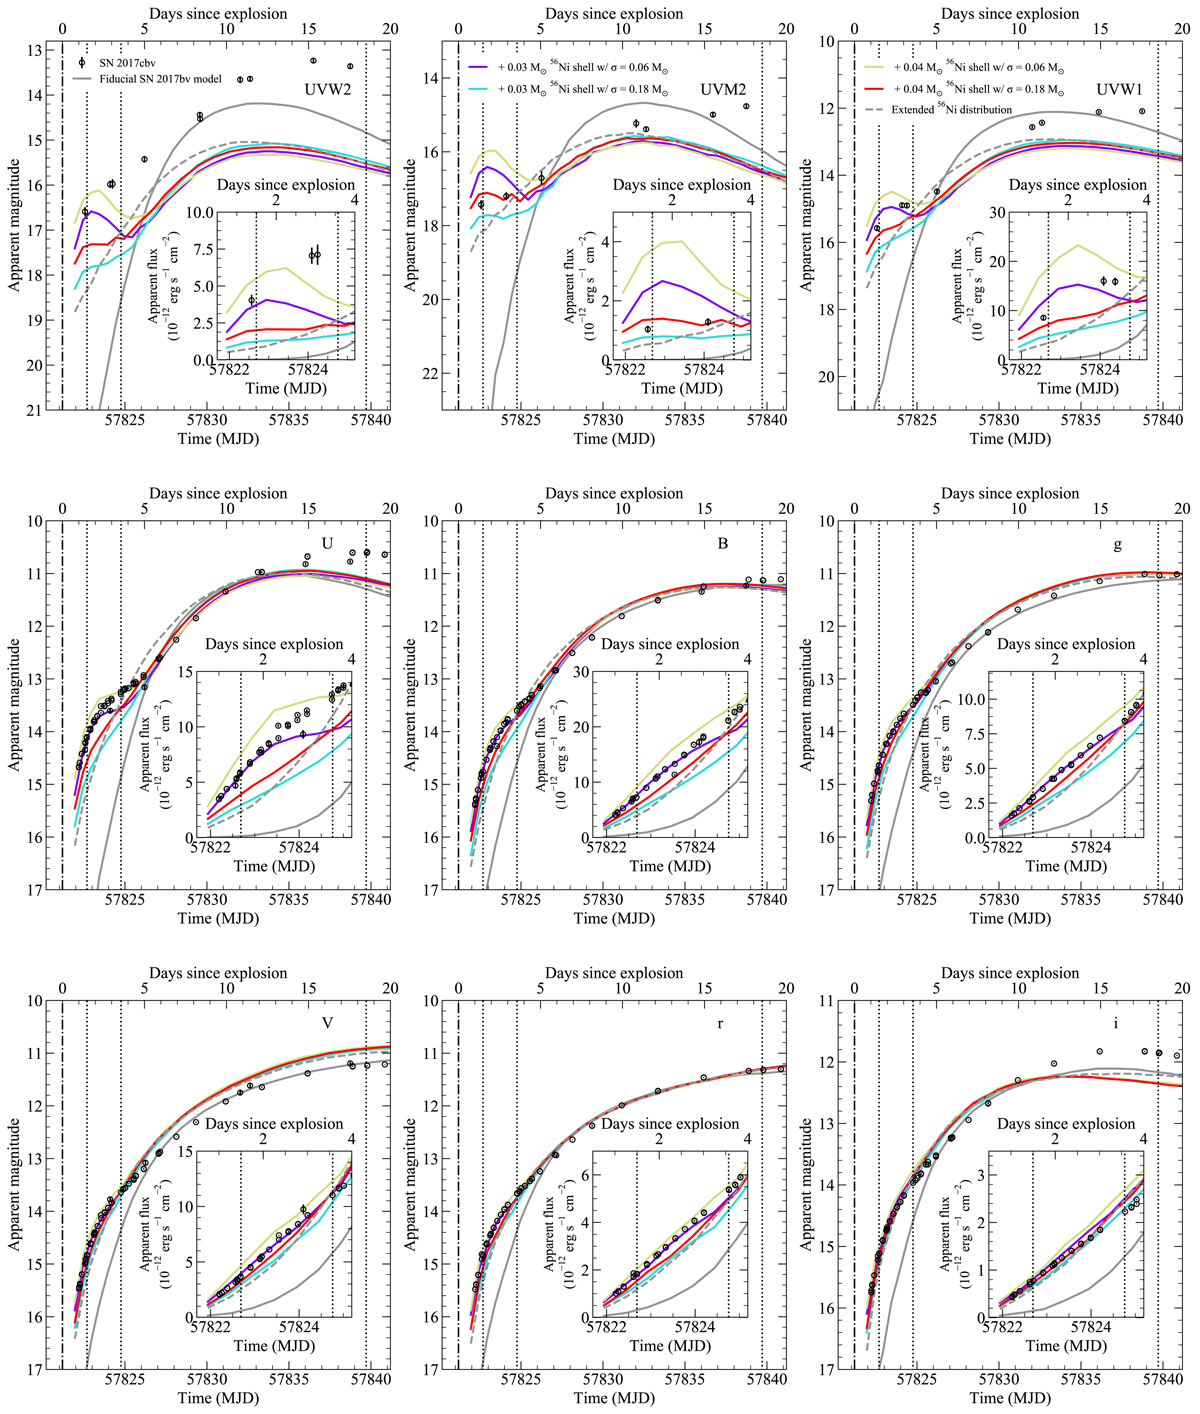
Comparison of SN 2017cbv light curves to models with and without 56Ni shells in the outer ejecta. SN 2017cbv is shown as black points. The fiducial model for SN 2017cbv is shown as a solid grey line. Models with 56Ni shells added to the fiducial model are shown as coloured lines. Based on comparisons to our models, we infer an explosion date of MJD = 57821.2, which is shown as a vertical dash-dot line. A model with an extended 56Ni distribution relative to our fiducial SN 2017cbv model is shown as a dashed line. The epochs of our spectral comparisons are shown as vertical dotted lines. In each panel we show a zoom-in of the first four days after explosion.
Current usage metrics show cumulative count of Article Views (full-text article views including HTML views, PDF and ePub downloads, according to the available data) and Abstracts Views on Vision4Press platform.
Data correspond to usage on the plateform after 2015. The current usage metrics is available 48-96 hours after online publication and is updated daily on week days.
Initial download of the metrics may take a while.