Fig. 3.
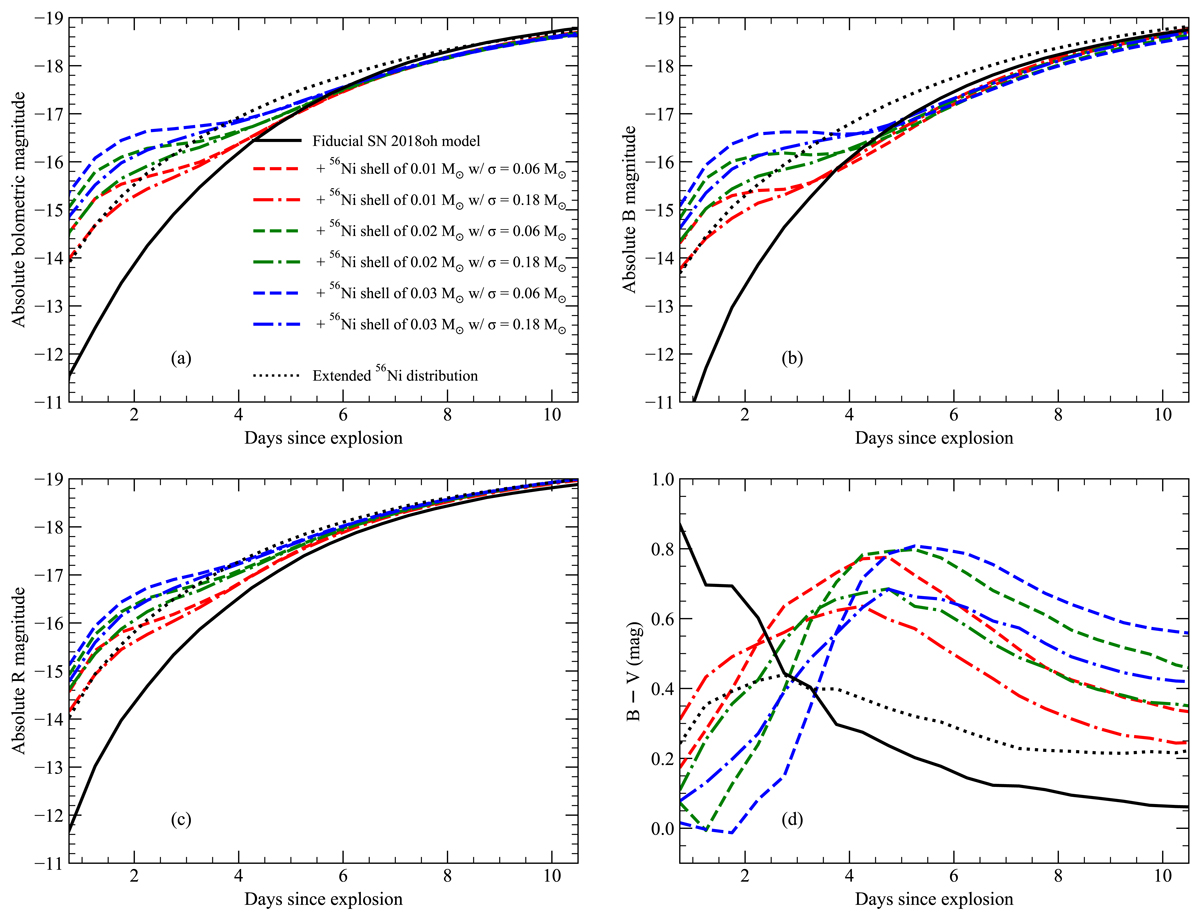
Light curves for models with and without shells of 56Ni in the outer ejecta. Panels a, b, and c show the bolometric, B-, and R-band magnitudes, respectively. The B − V colour evolution is shown in Panel d. We determine our fiducial model for SN 2018oh by finding the best match to the later light curve (excluding the early bump) among the models of Magee et al. (2020). This is shown as a black solid line. Coloured lines show light curves resulting from models with added shells of 56Ni in the outer ejecta, of varying masses. Each shell is centred on a mass coordinate of 1.35 M⊙ and has a width of either 0.06 or 0.18 M⊙. Dashed black lines show a model that has a more extended 56Ni distributions compared to our fiducial model, but is otherwise identical (i.e. the same density profile and 56Ni mass in each case). Our models demonstrate that bumps in the early light curves, of varying sizes and lengths, can be generated by different shells of 56Ni in the outer ejecta.
Current usage metrics show cumulative count of Article Views (full-text article views including HTML views, PDF and ePub downloads, according to the available data) and Abstracts Views on Vision4Press platform.
Data correspond to usage on the plateform after 2015. The current usage metrics is available 48-96 hours after online publication and is updated daily on week days.
Initial download of the metrics may take a while.