Fig. 2.
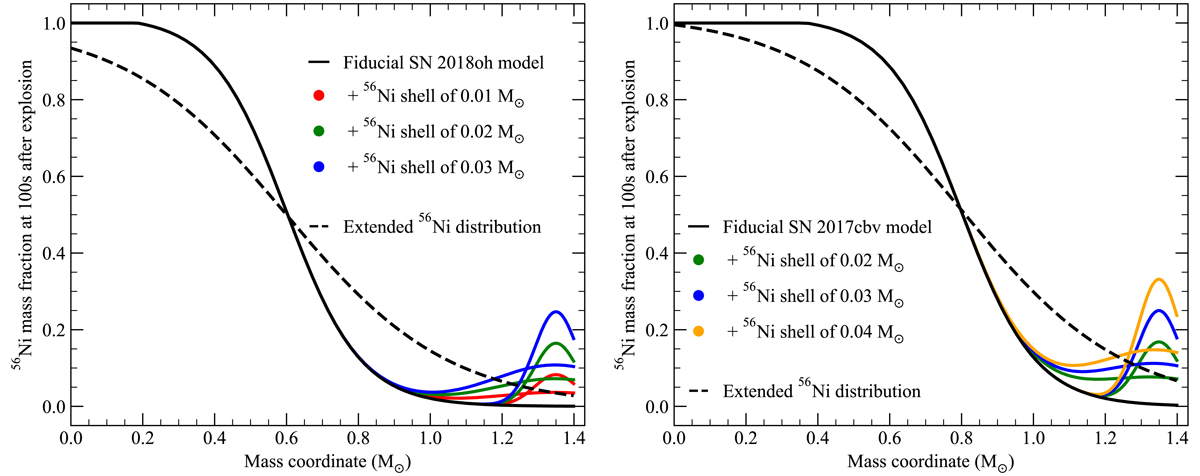
56Ni distributions for models explored as part of this work. Panels show the best matching models to the light curves beginning approximately five days after explosion (i.e. excluding the early bump) of SN 2018oh (left) and SN 2017cbv (right) as black solid lines, which we consider as our fiducial models. Dashed black lines show models that have more extended 56Ni distributions compared to our fiducial models, but are otherwise identical (i.e. the same density profile and 56Ni mass in each case). Coloured lines show 56Ni shells of varying masses. Each shell is centred on a mass coordinate of 1.35 M⊙ and has a width of either 0.06 or 0.18 M⊙.
Current usage metrics show cumulative count of Article Views (full-text article views including HTML views, PDF and ePub downloads, according to the available data) and Abstracts Views on Vision4Press platform.
Data correspond to usage on the plateform after 2015. The current usage metrics is available 48-96 hours after online publication and is updated daily on week days.
Initial download of the metrics may take a while.