Fig. 11.
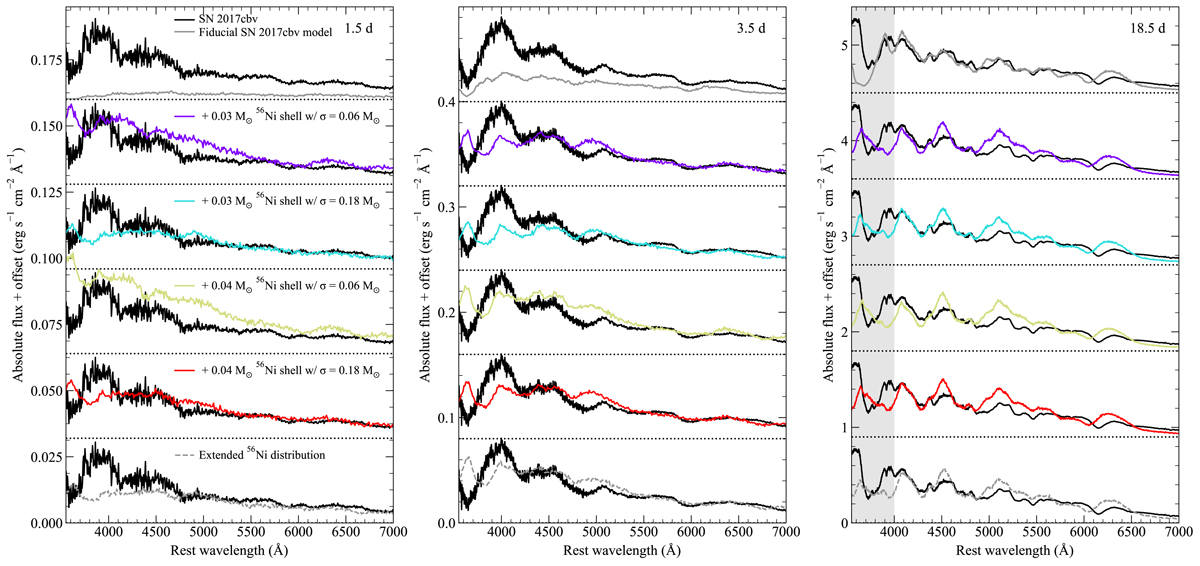
Spectral comparison between SN 2017cbv (black) and our models. From left to right panels show spectra at 1.5, 3.5, and 18.5 days after explosion. Each spectrum is offset vertically for clarity, with a dashed line showing the zero-point for each offset. The region showing strong flux suppression at maximum light in our shell models is given by a shaded grey region.
Current usage metrics show cumulative count of Article Views (full-text article views including HTML views, PDF and ePub downloads, according to the available data) and Abstracts Views on Vision4Press platform.
Data correspond to usage on the plateform after 2015. The current usage metrics is available 48-96 hours after online publication and is updated daily on week days.
Initial download of the metrics may take a while.