Fig. 9
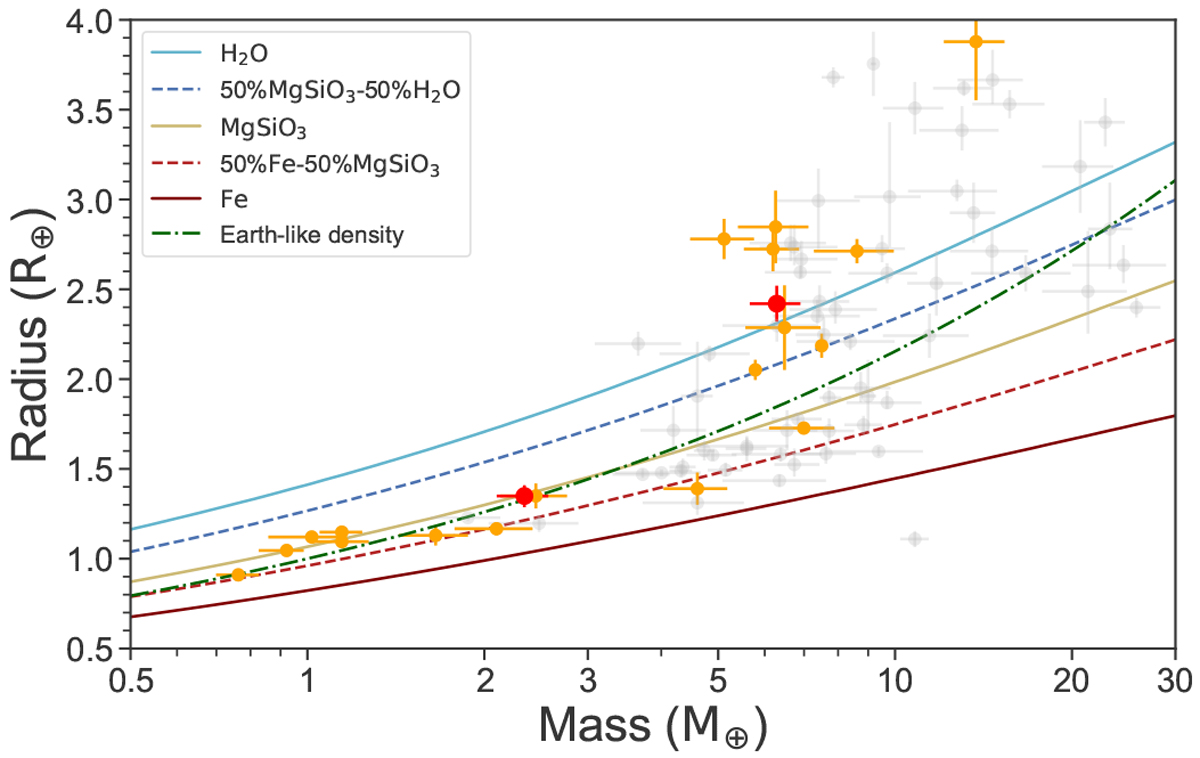
Mass-radius diagram for all planets with mass and radius measurement better than 20% (from the TEPCat8 database of well-characterised planets; Southworth 2011). M-dwarf host planets are shown in orange, LTT 3780 b and LTT 3780 c with red dots. Theoretical models (Zeng et al. 2016) are overplotted using different lines and colours.
Current usage metrics show cumulative count of Article Views (full-text article views including HTML views, PDF and ePub downloads, according to the available data) and Abstracts Views on Vision4Press platform.
Data correspond to usage on the plateform after 2015. The current usage metrics is available 48-96 hours after online publication and is updated daily on week days.
Initial download of the metrics may take a while.