Fig. 8
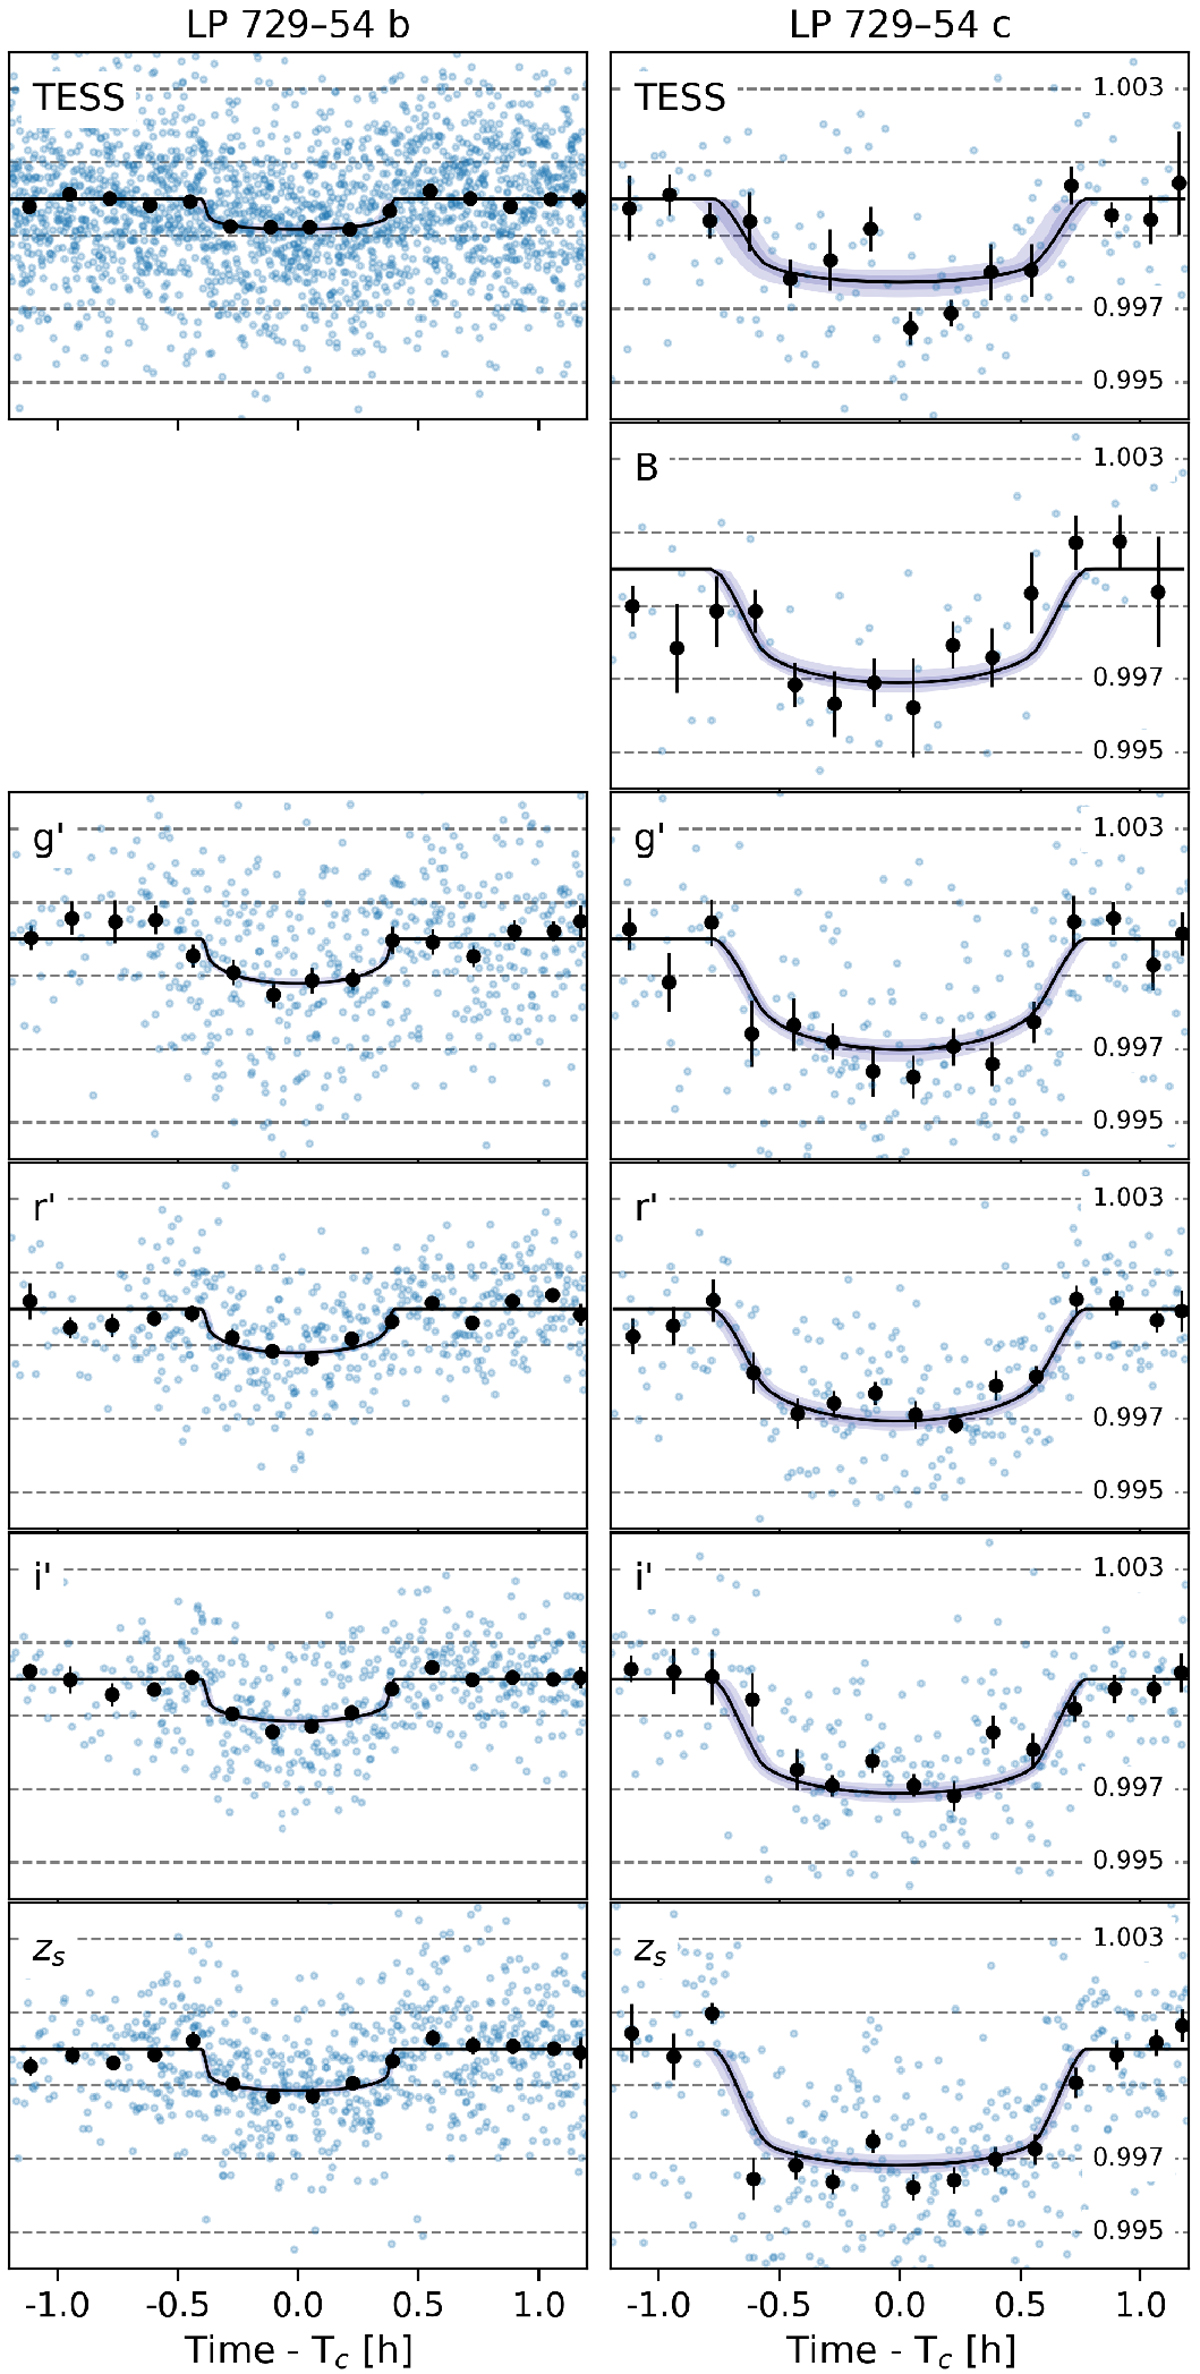
Combined and phase-folded transits of LTT 3780 b and c for each passband. The blue points show the original photometry with the median baseline model removed, the black dots with error bars show the photometry binned to 10 min resolution, the black line shows the median posterior model, and the dark and light shaded areas show the 68 and 95% model posterior percentile limits, respectively.
Current usage metrics show cumulative count of Article Views (full-text article views including HTML views, PDF and ePub downloads, according to the available data) and Abstracts Views on Vision4Press platform.
Data correspond to usage on the plateform after 2015. The current usage metrics is available 48-96 hours after online publication and is updated daily on week days.
Initial download of the metrics may take a while.