Fig. 4
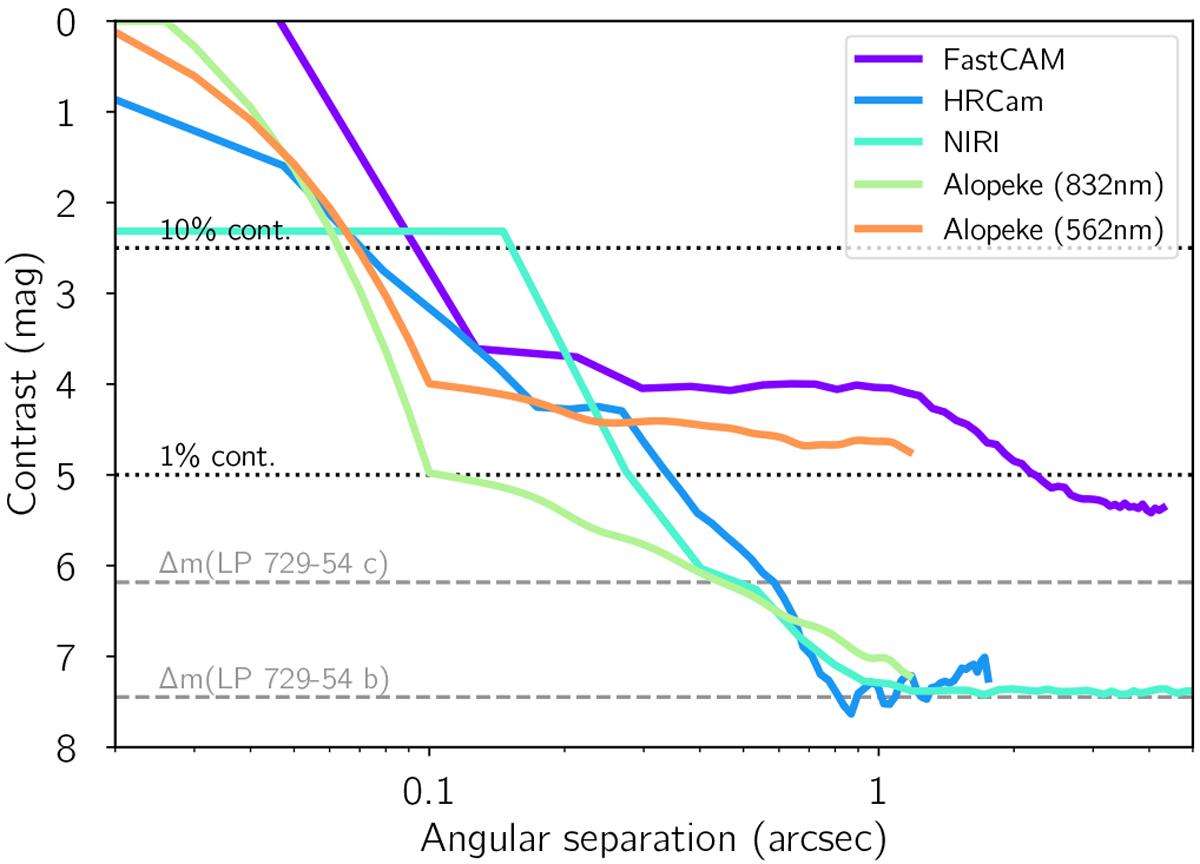
Sensitivity curves (5σ limits) for all five high-spatial resolution images used in this work. The 1 and 10% contamination levels are marked as black dotted horizontal lines and the maximum magnitude contrast that a blended binary could have to mimic the transit depth of the two planets in the system are marked as grey dashed horizontal lines.
Current usage metrics show cumulative count of Article Views (full-text article views including HTML views, PDF and ePub downloads, according to the available data) and Abstracts Views on Vision4Press platform.
Data correspond to usage on the plateform after 2015. The current usage metrics is available 48-96 hours after online publication and is updated daily on week days.
Initial download of the metrics may take a while.