Fig. 13
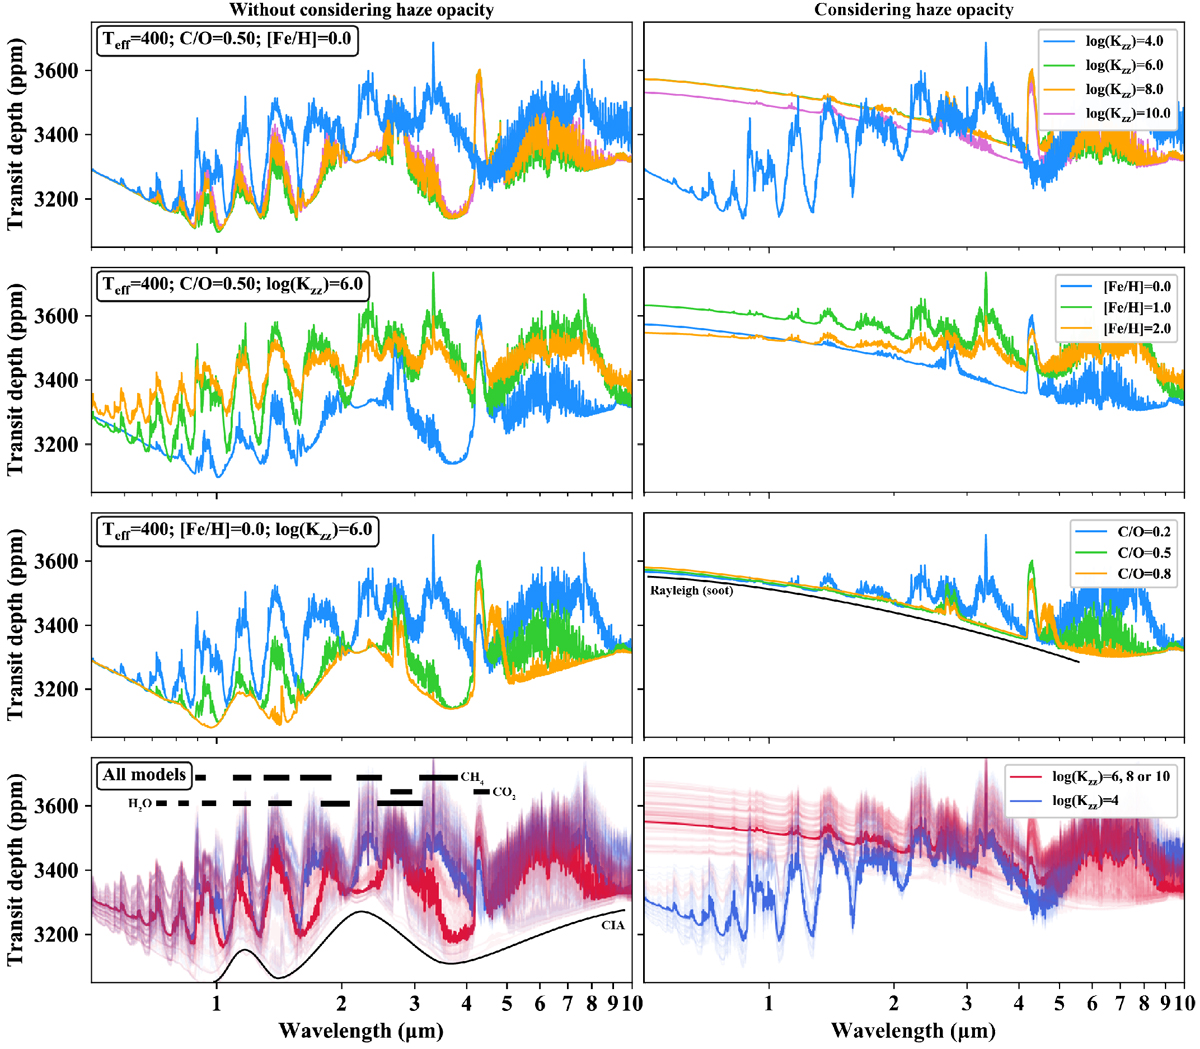
Synthetic transmission spectra of LTT 3780 c. Left panels: transmission spectra calculated without taking into account the opacity contribution of haze particles (soot). Top-left panel: variation of spectra with the strength of vertical mixing, corresponding to the cases in Fig. 11. Two middle panels: correspond to the two cases in Fig. 12. Bottom-left panel: transmission spectra of all 108 models in the two categories of strong (106, 108, or 1010 cm2 s−1) and weak (104 cm2 s−1) vertical mixing. Right panels: same as left panels, but with opacity of haze particles taken into account.
Current usage metrics show cumulative count of Article Views (full-text article views including HTML views, PDF and ePub downloads, according to the available data) and Abstracts Views on Vision4Press platform.
Data correspond to usage on the plateform after 2015. The current usage metrics is available 48-96 hours after online publication and is updated daily on week days.
Initial download of the metrics may take a while.