Fig. 11
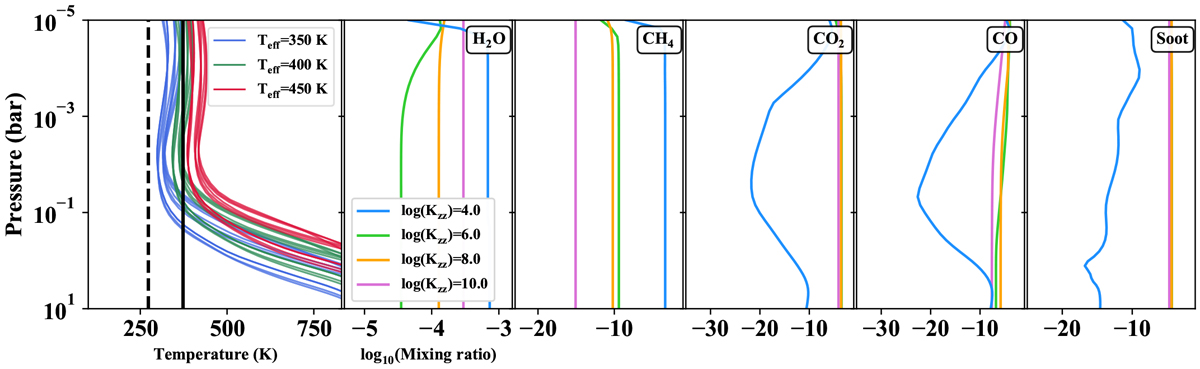
Left panel: simulated temperature structures of LTT 3780 c assuming a substantial primary atmosphere. Blue, green, and red curves represent the temperature profiles at different effective temperatures of 350, 400, and 450 K, respectively. Different profiles within each group are caused by different atmospheric metallicity and C/O ratio. There are 27 temperature structures in total. The dashed and solid black vertical lines mark 273.15 K (0 °C) and 373.15 K (100 °C) for reference. Remaining panels: examples of atmospheric abundances of H2O, CH4, CO2, CO, and soot (haze particles), for solar metallicity and C/O ratio, and effective temperature of 400 K, resulting from the photo-chemical simulations at different vertical mixing strengths.
Current usage metrics show cumulative count of Article Views (full-text article views including HTML views, PDF and ePub downloads, according to the available data) and Abstracts Views on Vision4Press platform.
Data correspond to usage on the plateform after 2015. The current usage metrics is available 48-96 hours after online publication and is updated daily on week days.
Initial download of the metrics may take a while.