Fig. 1
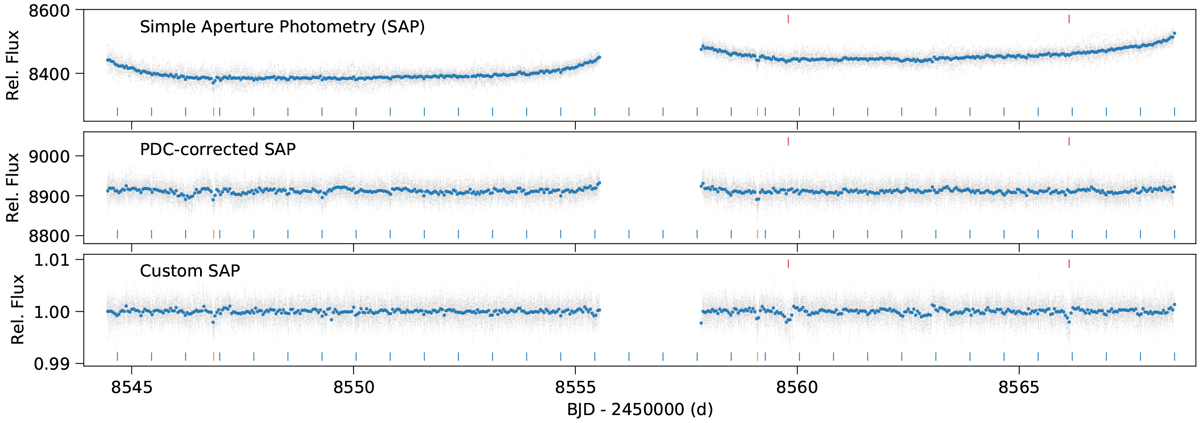
TESS data of LTT 3780. Top panel: simple-aperture photometry from SPOC pipeline. Middle panel: PDC-corrected photometry from SPOC pipeline. Bottom panel: custom-aperture photometry as in Hidalgo et al. (2020). Blue and orange ticks below the light curve mark the transits of the candidates TOI–732.01 (blue) and TOI–732.02 (orange). Red ticks above the light curves mark two dips that might correspond to single-transit events.
Current usage metrics show cumulative count of Article Views (full-text article views including HTML views, PDF and ePub downloads, according to the available data) and Abstracts Views on Vision4Press platform.
Data correspond to usage on the plateform after 2015. The current usage metrics is available 48-96 hours after online publication and is updated daily on week days.
Initial download of the metrics may take a while.