Fig. 8.
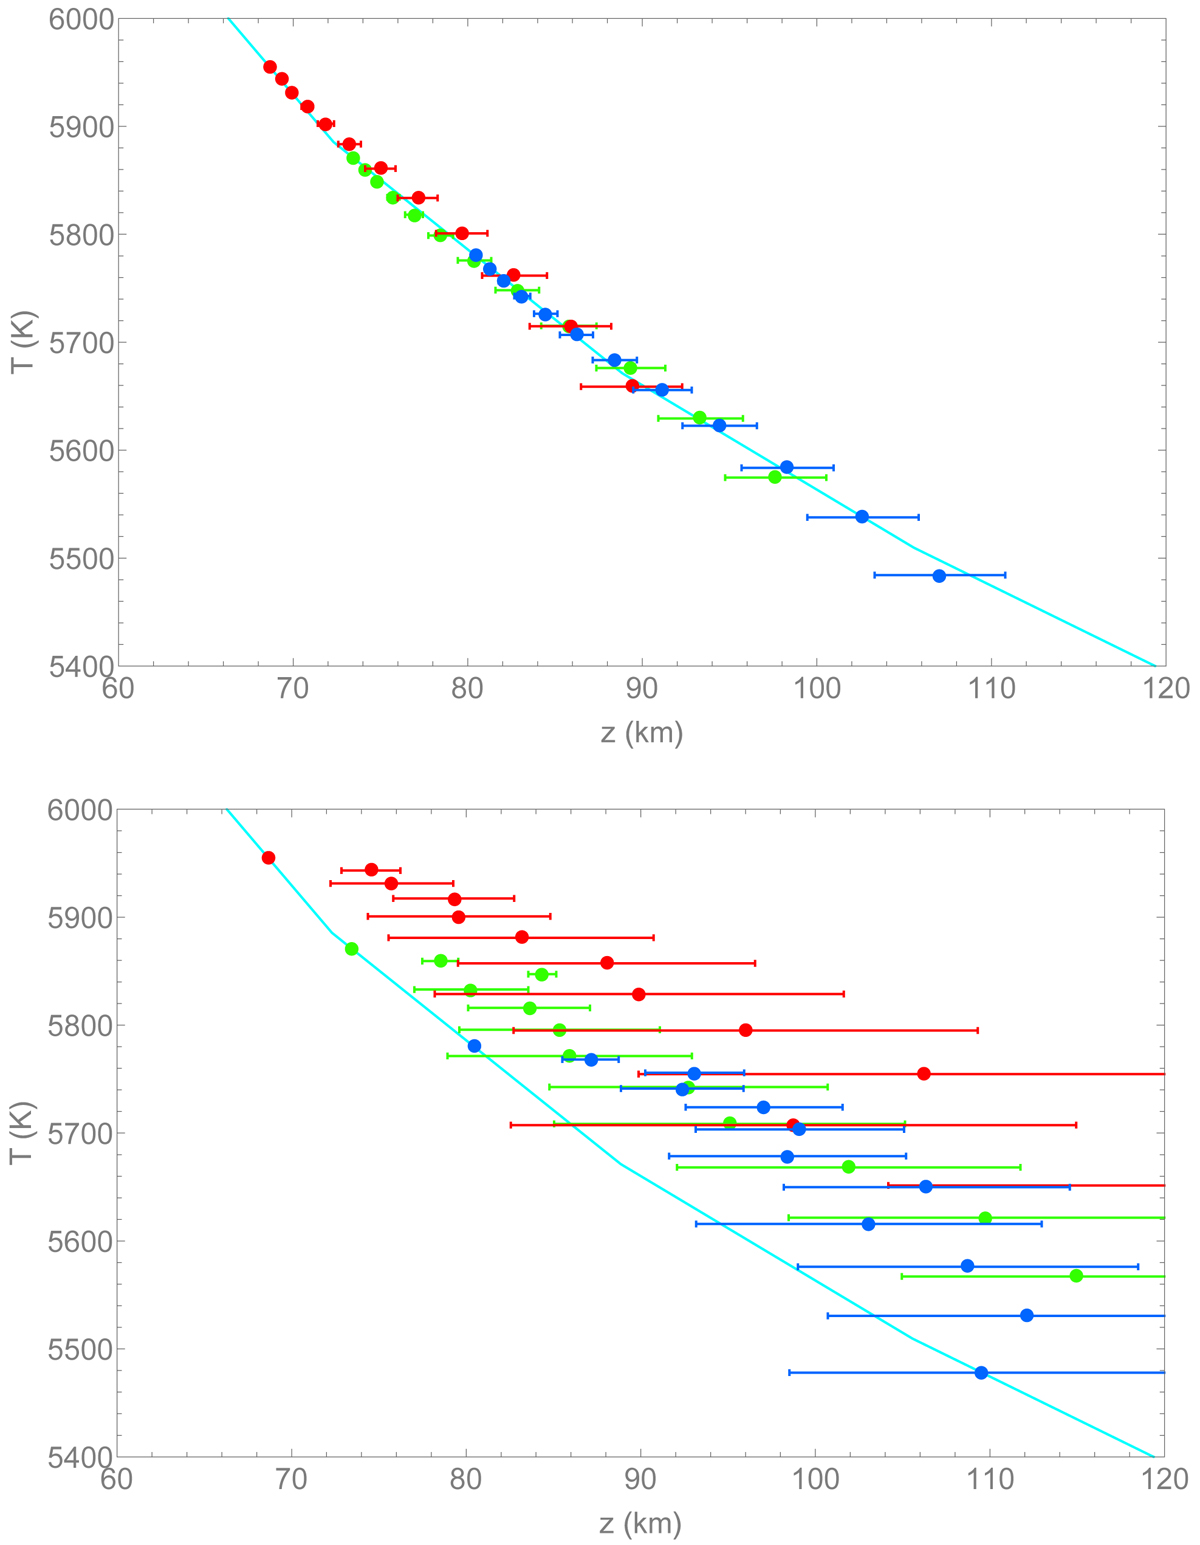
Temperature gradient measured on five snapshots of the simulation with ⟨B ⟩ ≃100 G using the FeI 630.15 nm line under bad seeing conditions (r0 = 5 cm). The light-blue full line shows the temperature gradient derived from the simulation. Red dots: measurements at μ = 0.9, green dots: measurements at μ = 0.8, blue dots: measurements at μ = 0.7. The error bars show the one-sigma uncertainty on the depth measurements. Upper panel: with AO, lower panel: without AO.
Current usage metrics show cumulative count of Article Views (full-text article views including HTML views, PDF and ePub downloads, according to the available data) and Abstracts Views on Vision4Press platform.
Data correspond to usage on the plateform after 2015. The current usage metrics is available 48-96 hours after online publication and is updated daily on week days.
Initial download of the metrics may take a while.