Fig. A.3.
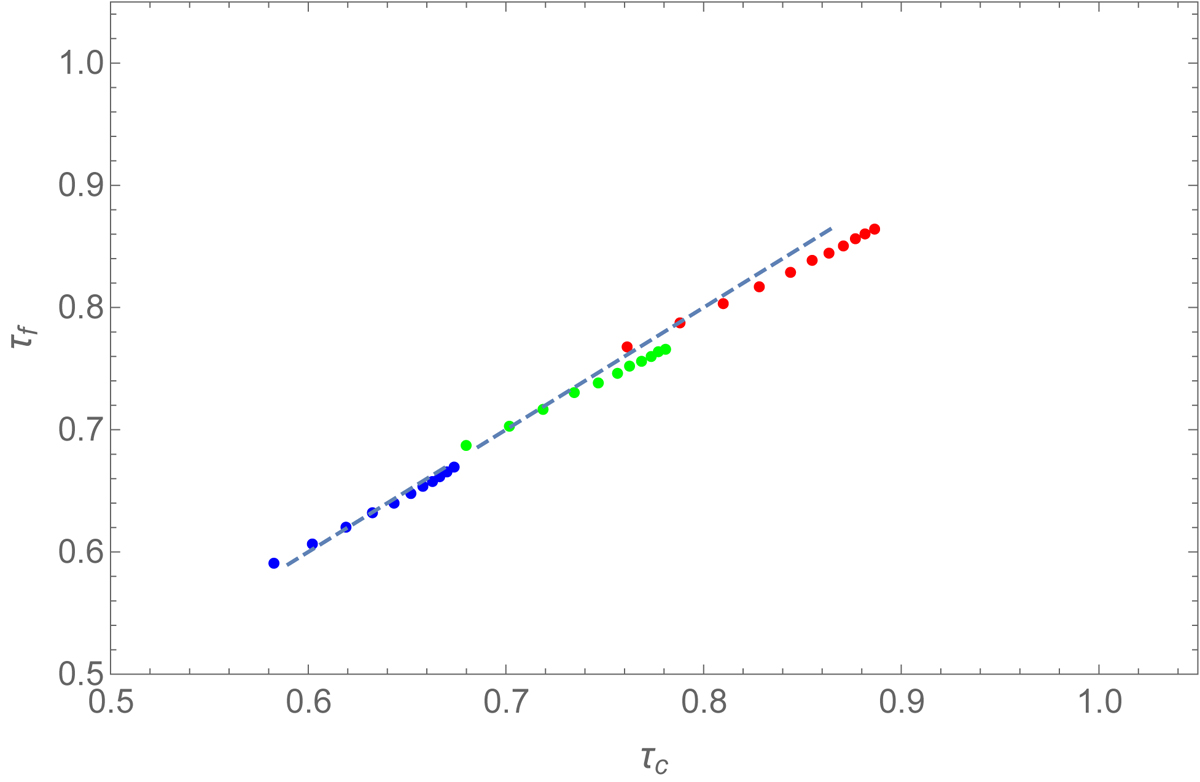
Vertical axis: formation-depth of the average line-wing radiation according to the Milne-Eddington model; horizontal axis: continuum optical depth where the average Planck function is equal to the average line-wing radiation. Red dots are line cords 15 to 25 at μ = 0.9; green dots are line cords 15 to 25 at μ = 0.8, blue dots are line cords 15 to 25 at μ = 0.7. Dashed lines show the first bisector.
Current usage metrics show cumulative count of Article Views (full-text article views including HTML views, PDF and ePub downloads, according to the available data) and Abstracts Views on Vision4Press platform.
Data correspond to usage on the plateform after 2015. The current usage metrics is available 48-96 hours after online publication and is updated daily on week days.
Initial download of the metrics may take a while.