Open Access
Fig. A.1.
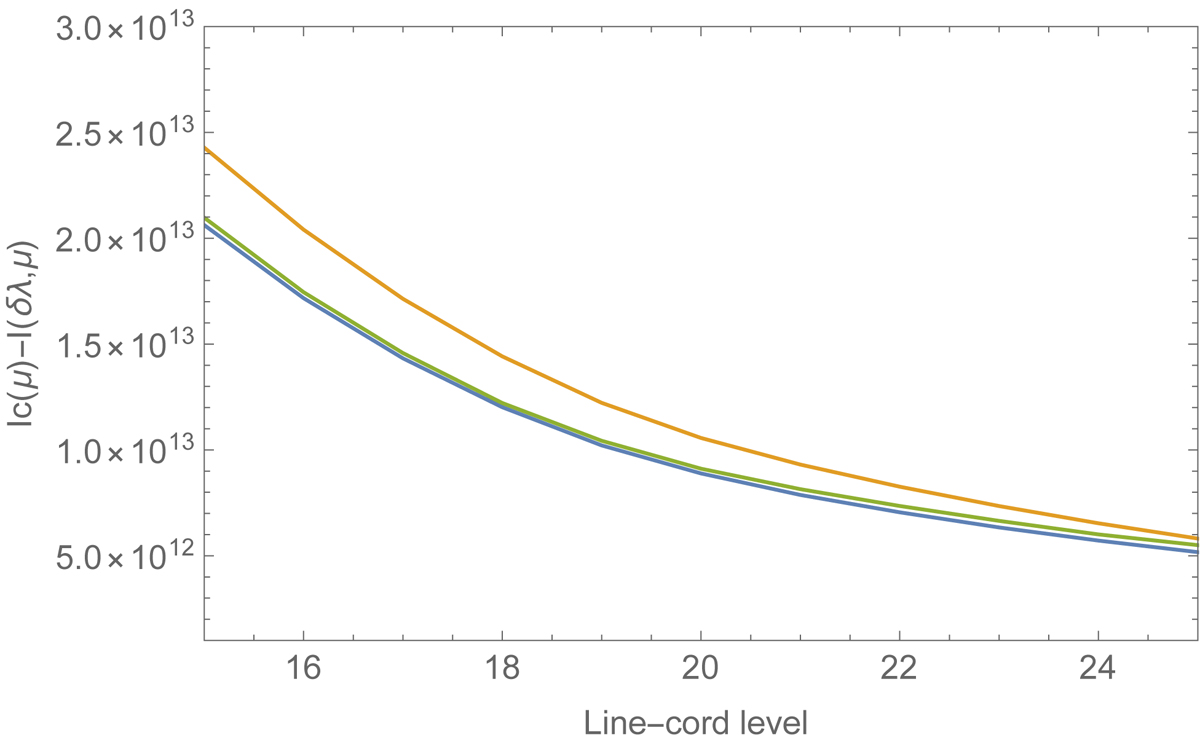
Line depression, in cgs units, at the line-cord levels 15 to 25 averaged over 20″ × 20″ images, for three values of μ. Blue line: μ = 0.7, green line: μ = 0.8, orange line: μ = 0.9.
Current usage metrics show cumulative count of Article Views (full-text article views including HTML views, PDF and ePub downloads, according to the available data) and Abstracts Views on Vision4Press platform.
Data correspond to usage on the plateform after 2015. The current usage metrics is available 48-96 hours after online publication and is updated daily on week days.
Initial download of the metrics may take a while.