Free Access
Fig. 7.
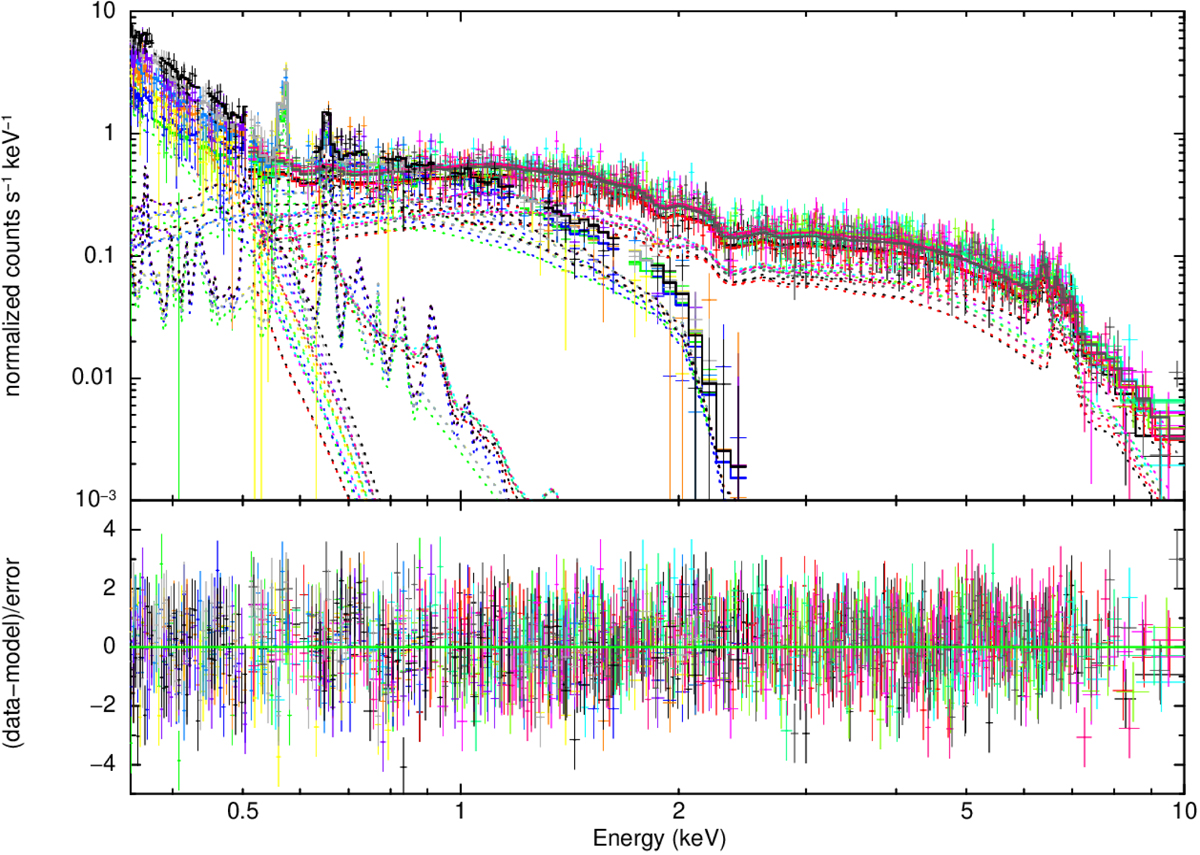
Bright-phase EPIC-MOS and RGS spectra of AM Herculis obtained in 2005 with best-fitting model B. The individual model components are shown with dotted lines. Lower panel: residuals with respect to the best fit in units of σ. Different colors were used to indicate data from the different instruments involved in the fit.
Current usage metrics show cumulative count of Article Views (full-text article views including HTML views, PDF and ePub downloads, according to the available data) and Abstracts Views on Vision4Press platform.
Data correspond to usage on the plateform after 2015. The current usage metrics is available 48-96 hours after online publication and is updated daily on week days.
Initial download of the metrics may take a while.