Fig. 6.
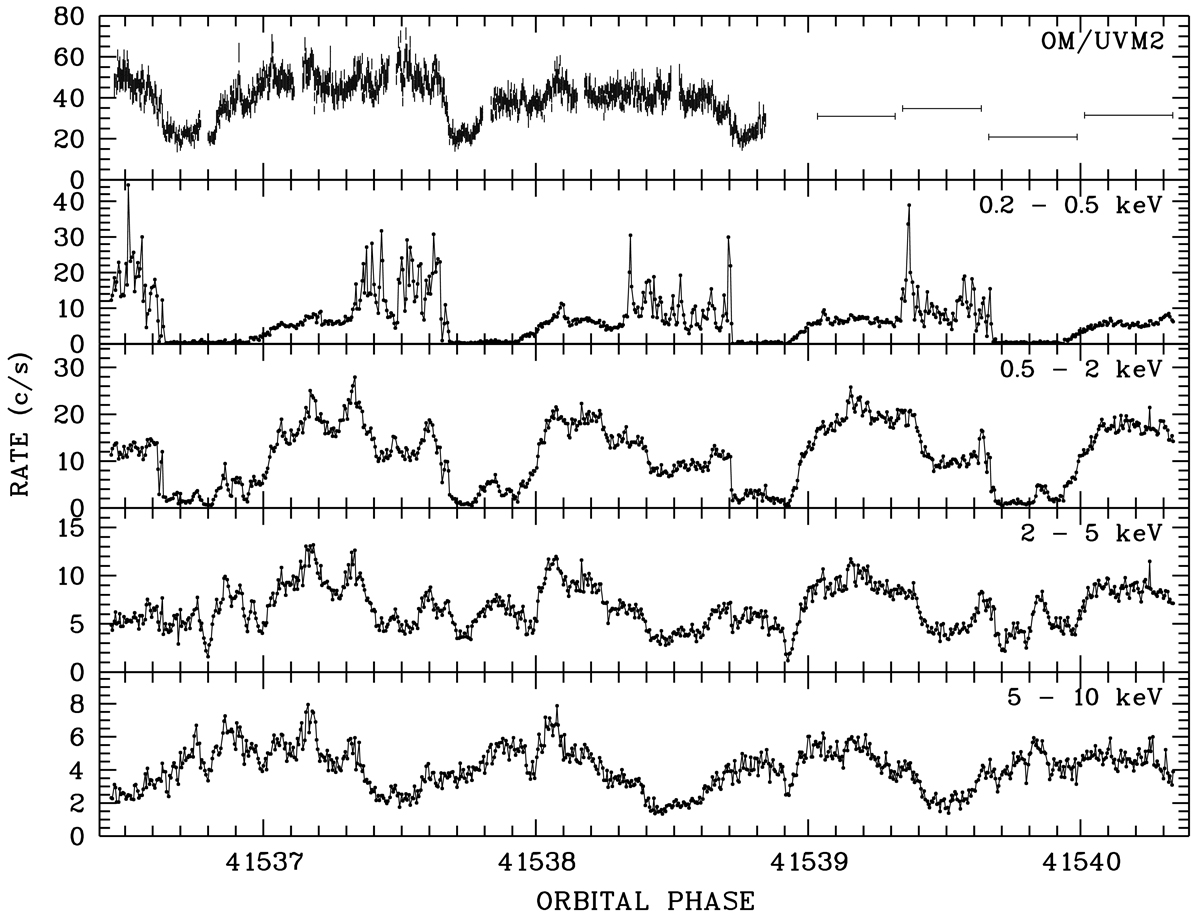
Energy-dependent EPIC-pn X-ray and OM UV light curves of the 2015 observation obtained with XMM-Newton. Time bins are 10 s for the UV and 60 s for the X-ray spectral range. The horizontal bars in the upper panel indicate the length and the mean brightness between 2200 and 2400 Å of the four grism spectra. Spectral flux density was converted to count rate using the conversion factor given in the XMM-Newton users handbook.
Current usage metrics show cumulative count of Article Views (full-text article views including HTML views, PDF and ePub downloads, according to the available data) and Abstracts Views on Vision4Press platform.
Data correspond to usage on the plateform after 2015. The current usage metrics is available 48-96 hours after online publication and is updated daily on week days.
Initial download of the metrics may take a while.