Free Access
Fig. 5.
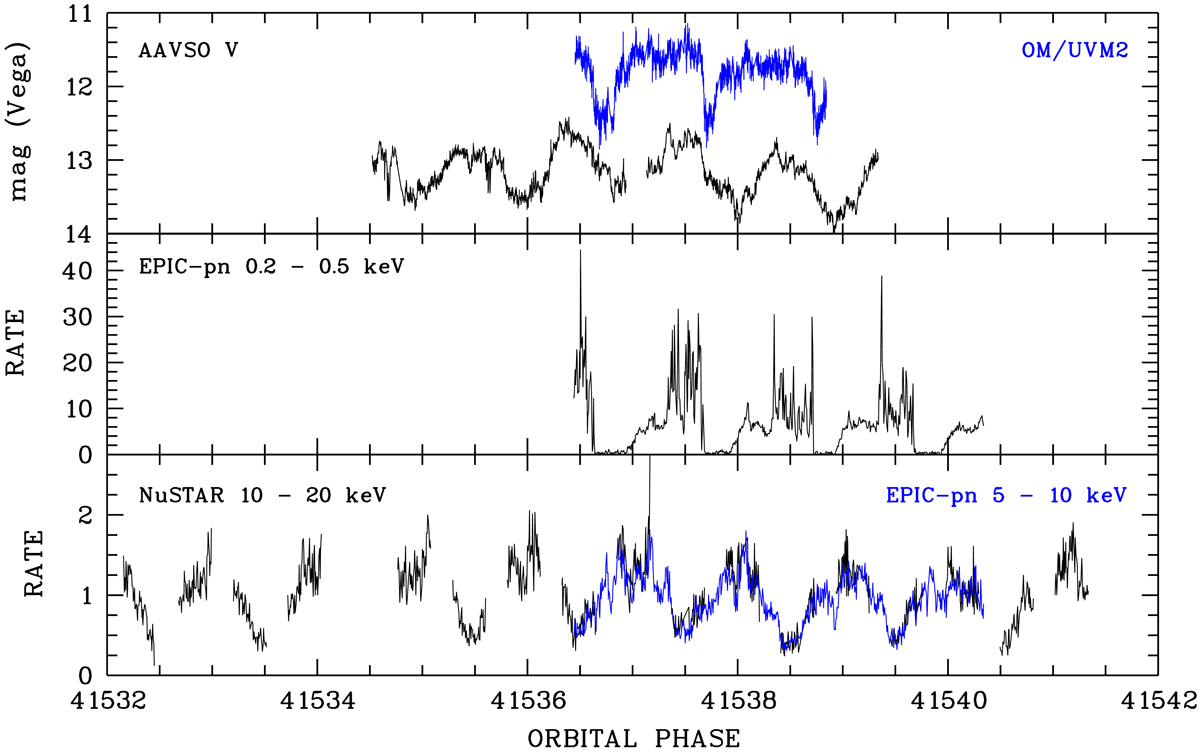
From top to bottom: light curves obtained during the multi-observatory campaign in 2015 in original time sequence. Facilities used are indicated in the individual panels. Time bins are 10 s for the OM, and 60 s for EPIC-pn and NuSTAR, respectively.
Current usage metrics show cumulative count of Article Views (full-text article views including HTML views, PDF and ePub downloads, according to the available data) and Abstracts Views on Vision4Press platform.
Data correspond to usage on the plateform after 2015. The current usage metrics is available 48-96 hours after online publication and is updated daily on week days.
Initial download of the metrics may take a while.