Fig. 4.
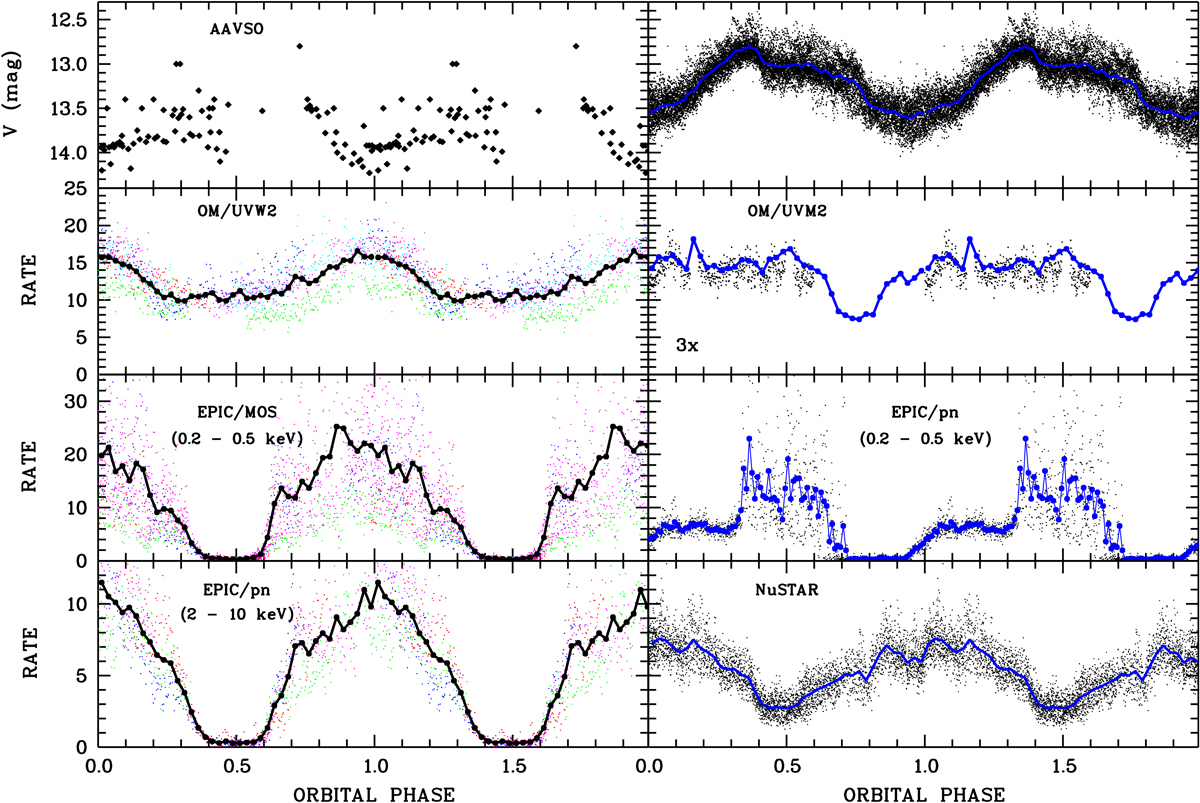
From top to bottom: optical, ultraviolet, soft, and hard X-ray light curves obtained in 2005 (left) and 2015 (right). They were obtained from the AAVSO data base, with the optical monitor and with EPIC onboard XMM-Newton, and with NuSTAR, respectively. Original photon data were binned with a time bin size of 30 s. Phase-averaged light curves have 40 bins per orbital cycle. All data are shown twice for better visibility. The OM-filters were not the same in 2005 and 2015. The y-axis scale for 2015 have been compressed by a factor of 3. The soft X-ray light curves (third panel from above) were built using photons in the energy range 0.2−0.5 keV with EPIC-MOS (2005) and EPIC-pn (2015) with the thin and the thick filters, respectively (see Table 1). The hard X-ray light curves are based on EPIC-pn (2005) covering the energy range 2−10 keV and NuSTAR (2015, no energy selection). Colors of individual data points obtained in 2005 indicate different satellite orbits (2005 data, color – orbit): green – 1027, red – 1028, cyan – 1029, blue – 1030, magenta – 1031.
Current usage metrics show cumulative count of Article Views (full-text article views including HTML views, PDF and ePub downloads, according to the available data) and Abstracts Views on Vision4Press platform.
Data correspond to usage on the plateform after 2015. The current usage metrics is available 48-96 hours after online publication and is updated daily on week days.
Initial download of the metrics may take a while.