Fig. 18.
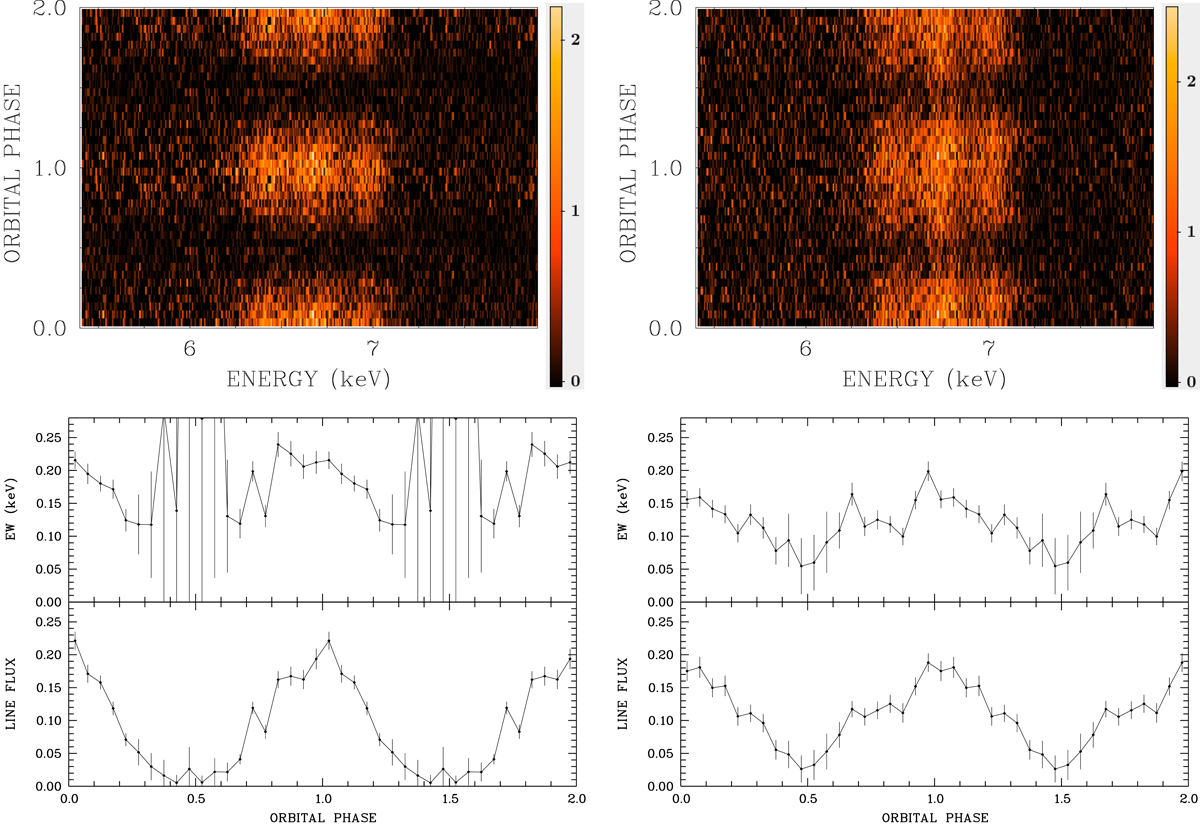
Top: continuum-subtracted phase-averaged EPIC-pn spectra of AM Herculis obtained in 2005 (left) and in 2015 (right) arranged as apparent trailed spectrograms. Only the region around the Fe-line complex is shown. The original data were arranged in 20 phase bins and energy bins of 5 eV. The color bars indicate spectral flux in counts s−1 keV−1. Bottom: line flux and equivalent widths of the neutral Fe-line as a function of binary phase. The same data are shown twice in all panels just for better visibility of repetitive features.
Current usage metrics show cumulative count of Article Views (full-text article views including HTML views, PDF and ePub downloads, according to the available data) and Abstracts Views on Vision4Press platform.
Data correspond to usage on the plateform after 2015. The current usage metrics is available 48-96 hours after online publication and is updated daily on week days.
Initial download of the metrics may take a while.