Fig. 17.
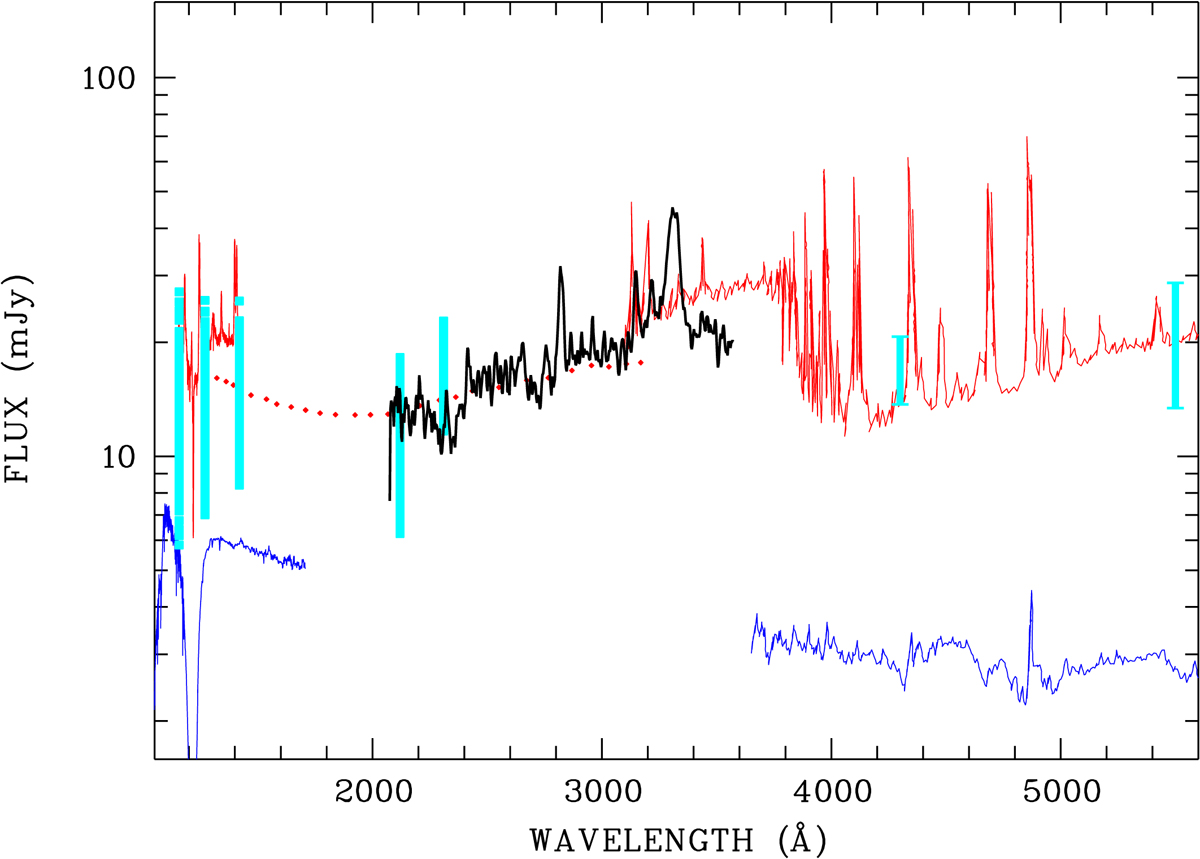
UV-to-optical spectral energy distribution in low and high states. Spectra shown in blue were obtained in low states by Gänsicke et al. (2006) and Schmidt et al. (1981), those in red in high states by Schachter et al. (1991) and Gänsicke et al. (1998). The OM grism spectrum shown in black is the mean of spectra #12, 13, and 15. The vertical lines in cyan indicate phase-dependent variability from time-resolved spectroscopy and photometry with the HST/GHRS, the OM with filters UVW2 (2144 Å) and UVM2 (2327 Å), and from the AAVSO through filters B and V. The red dotted line indicates the high-state bright-phase UV continuum measured by Gänsicke et al. (1995).
Current usage metrics show cumulative count of Article Views (full-text article views including HTML views, PDF and ePub downloads, according to the available data) and Abstracts Views on Vision4Press platform.
Data correspond to usage on the plateform after 2015. The current usage metrics is available 48-96 hours after online publication and is updated daily on week days.
Initial download of the metrics may take a while.