Free Access
Fig. 1.
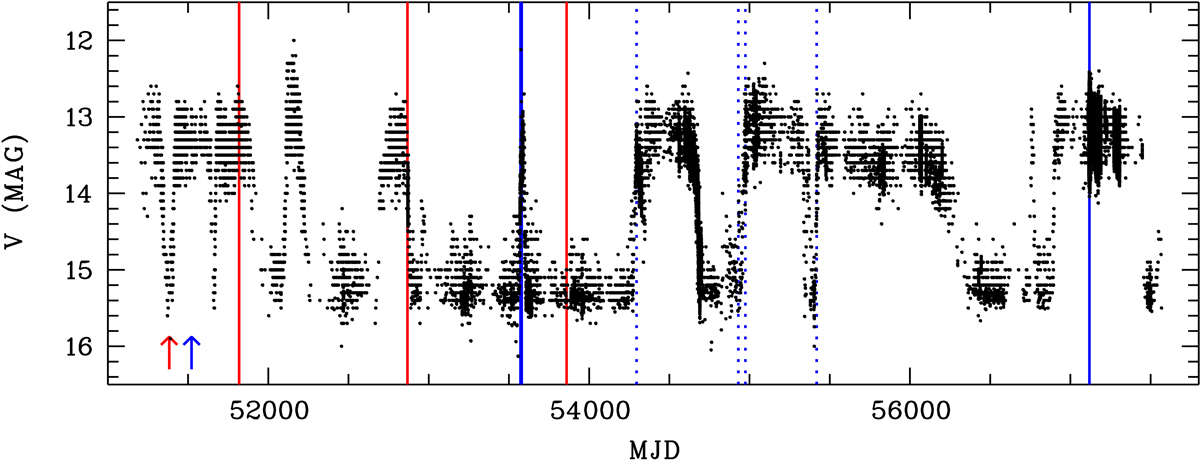
AAVSO V-band light curve between January 1, 1999, and June 20, 2016. Launch dates of XMM-Newton and Chandra are indicated by blue and red arrows. X-ray observations with those observatories are indicated by vertical lines. XMM-Newton slew observations are indicated with dotted lines.
Current usage metrics show cumulative count of Article Views (full-text article views including HTML views, PDF and ePub downloads, according to the available data) and Abstracts Views on Vision4Press platform.
Data correspond to usage on the plateform after 2015. The current usage metrics is available 48-96 hours after online publication and is updated daily on week days.
Initial download of the metrics may take a while.