Fig. 9
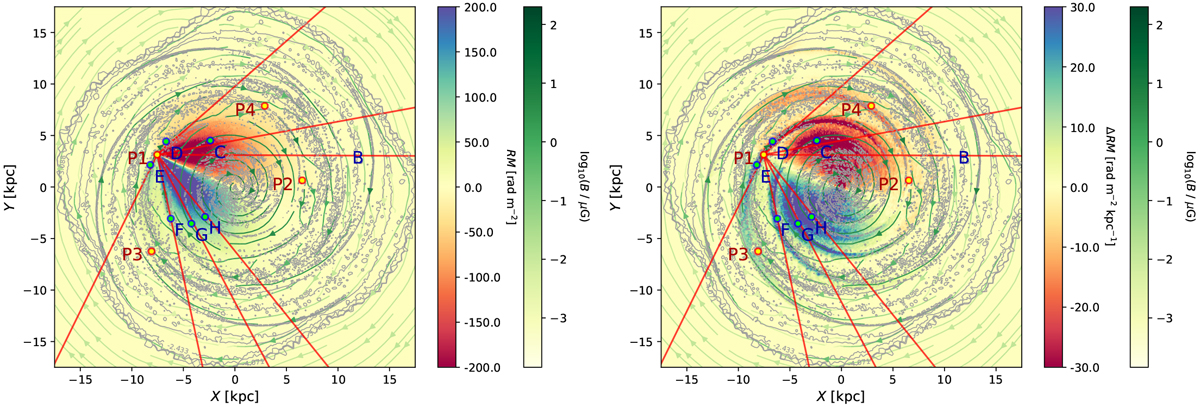
Left panel: accumulated values of the RM along all LOSs that lie within the Galactic disk plane. All LOSs start outside the MHD grid with RM = 0 rad m−2 and incrementally converge with each step size dℓ inward at the very observer position P1 where the RM reaches its maximum. The magnitude of the resulting RM signal at position P1 is shown in Fig. 5, left panel. Gray contours indicate the electron density and the vector field represents the magnetic field strength and orientation (see Fig. 2). Red lines are the tangents B–H detected by the RM signal, whereas blue dots represent the tangent points derived from the column density map shown in Fig. 6. Right panel: same as the left panel, but the relative change
![]() is plotted along all LOSs as they approach P1.
is plotted along all LOSs as they approach P1.
Current usage metrics show cumulative count of Article Views (full-text article views including HTML views, PDF and ePub downloads, according to the available data) and Abstracts Views on Vision4Press platform.
Data correspond to usage on the plateform after 2015. The current usage metrics is available 48-96 hours after online publication and is updated daily on week days.
Initial download of the metrics may take a while.