Fig. 7
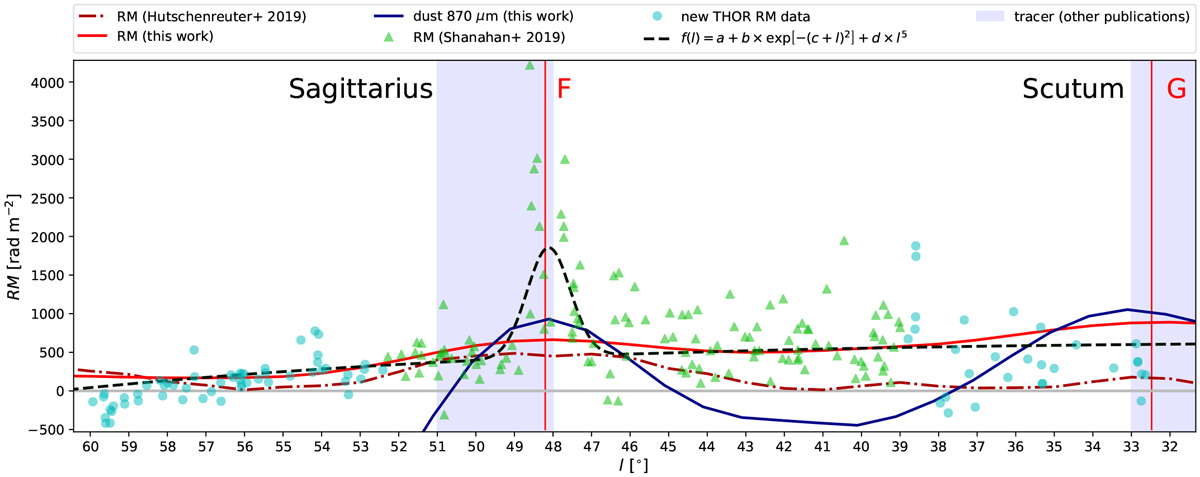
Synthetic and measured RM values. The synthetic RM (solid red) and synthetic dust (solid blue) are compared to the RM observations (dash-dotted brown) derived from the Hutschenreuter & Enßlin (2020) map and the THOR survey, respectively. The THOR data contains measurements (green triangles) already published in Shanahan et al. (2019) as well as newly calculated RM values (green dots). All synthetic profiles are shifted and mirrored to match their tangent point F, which is the peak value of the Shanahan et al. (2019) data at l = 48.6° in the Galactic coordinate system. For comparison, the synthetic dust profile shown in Fig. 4 is magnified to match the RM data. The parameters of the function f(l) are fitted to the full THOR data set (dashed black). Vertical red lines indicate the tangent points F and G of the synthetic RM profile shown in Fig. 5, whereas vertical blue bars indicate the range of tangent points of different tracers for the Sagittarius and the Scutum arm of the Milky Way.
Current usage metrics show cumulative count of Article Views (full-text article views including HTML views, PDF and ePub downloads, according to the available data) and Abstracts Views on Vision4Press platform.
Data correspond to usage on the plateform after 2015. The current usage metrics is available 48-96 hours after online publication and is updated daily on week days.
Initial download of the metrics may take a while.