Fig. 6
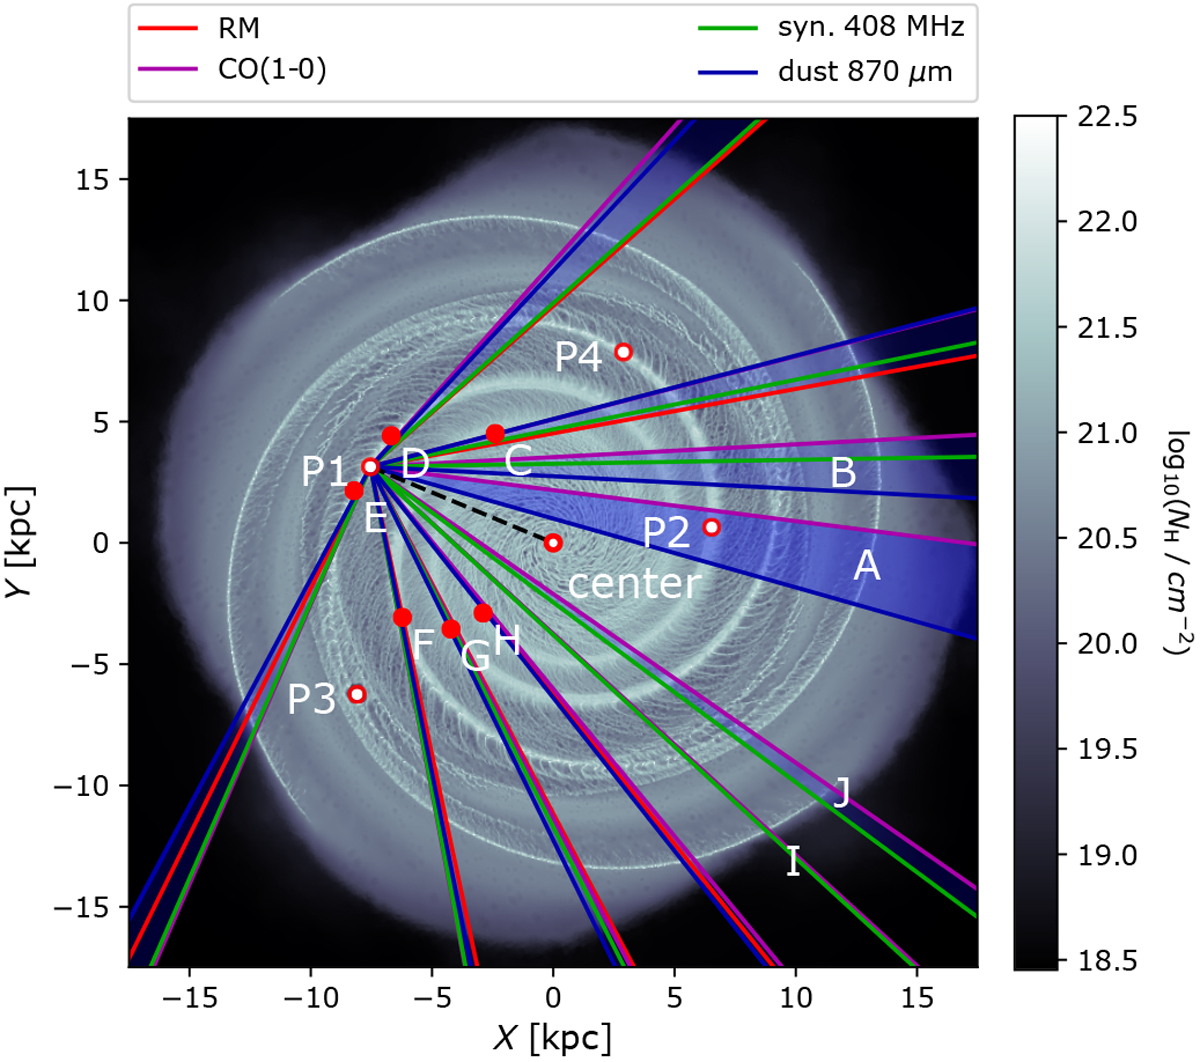
Face-on column density map of our Milky Way model. Red circles are the observer positions and the Galactic center, while red dots represent the tangent points. The black dashed line represents the LOS toward the center (i.e., l = 0° in the Galactic coordinate system). Colored lines indicate the detected spiral arms for different tracers, and the blue shaded areas show the angular range of detections for each spiral arm.
Current usage metrics show cumulative count of Article Views (full-text article views including HTML views, PDF and ePub downloads, according to the available data) and Abstracts Views on Vision4Press platform.
Data correspond to usage on the plateform after 2015. The current usage metrics is available 48-96 hours after online publication and is updated daily on week days.
Initial download of the metrics may take a while.