Fig. 5
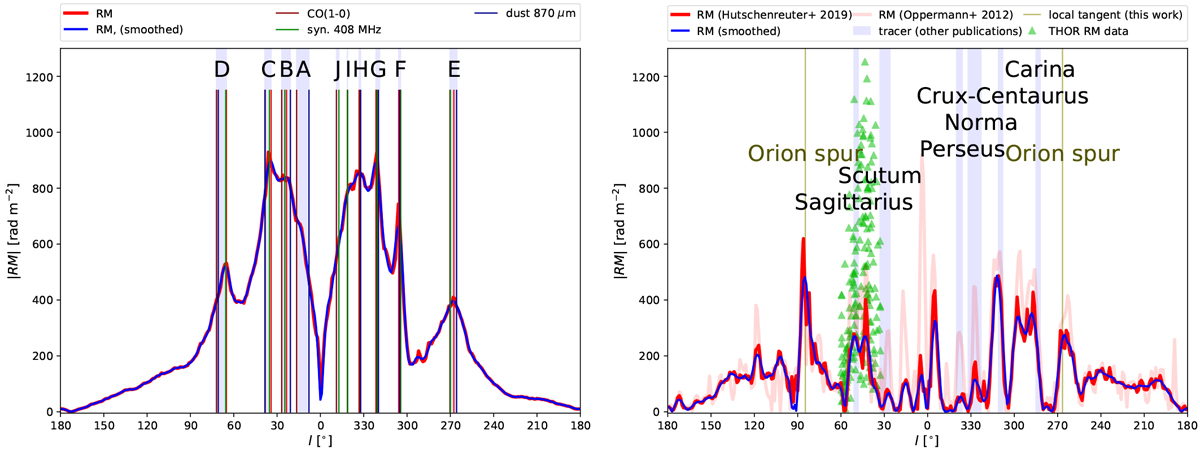
Left: synthetic RM profile of our Milky Way model as a function of longitude l. Vertical lines represent the tangent point detections as derived from the distinct tracers listed in Table 1. Vertical shaded bars and labels indicate the angular range of the detections for all tracers per spiral arm. Right: same as the left panel, but for the observed Milky Way RM (Oppermann et al. 2012; Hutschenreuter & Enßlin 2020). Green triangles indicate the THOR RM data presented in Shanahan et al. (2019) as well as newly derived data points. Some of the THOR data points beyond 1300 rad m−2 were cut for better comparability with the left panel.
Current usage metrics show cumulative count of Article Views (full-text article views including HTML views, PDF and ePub downloads, according to the available data) and Abstracts Views on Vision4Press platform.
Data correspond to usage on the plateform after 2015. The current usage metrics is available 48-96 hours after online publication and is updated daily on week days.
Initial download of the metrics may take a while.