Fig. 4
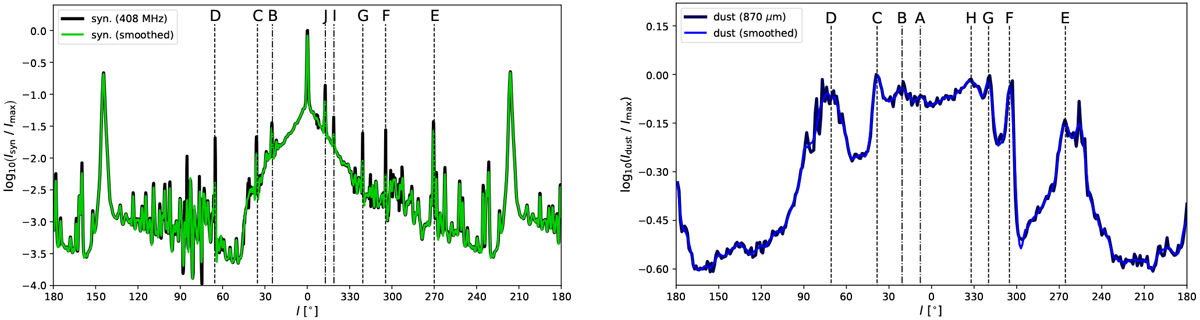
Longitudinal profiles of the 408 MHz synchrotron emission (left) and 870 μm dust emission (right) for our Milky Way model. The panels show the synchrotron emission averaged profile and the dust (blue). The profiles in green and blue are smoothed over 3° along the longitude. Vertical black dashed lines and letters indicate tangent points of the spiral arms as detected from each tracer. The longitude of the tangent points are not identical in the left and right panels since the exact position depends on the tracer (see Table 1). All profiles are normalized by their peak values for better comparison and analysis.
Current usage metrics show cumulative count of Article Views (full-text article views including HTML views, PDF and ePub downloads, according to the available data) and Abstracts Views on Vision4Press platform.
Data correspond to usage on the plateform after 2015. The current usage metrics is available 48-96 hours after online publication and is updated daily on week days.
Initial download of the metrics may take a while.